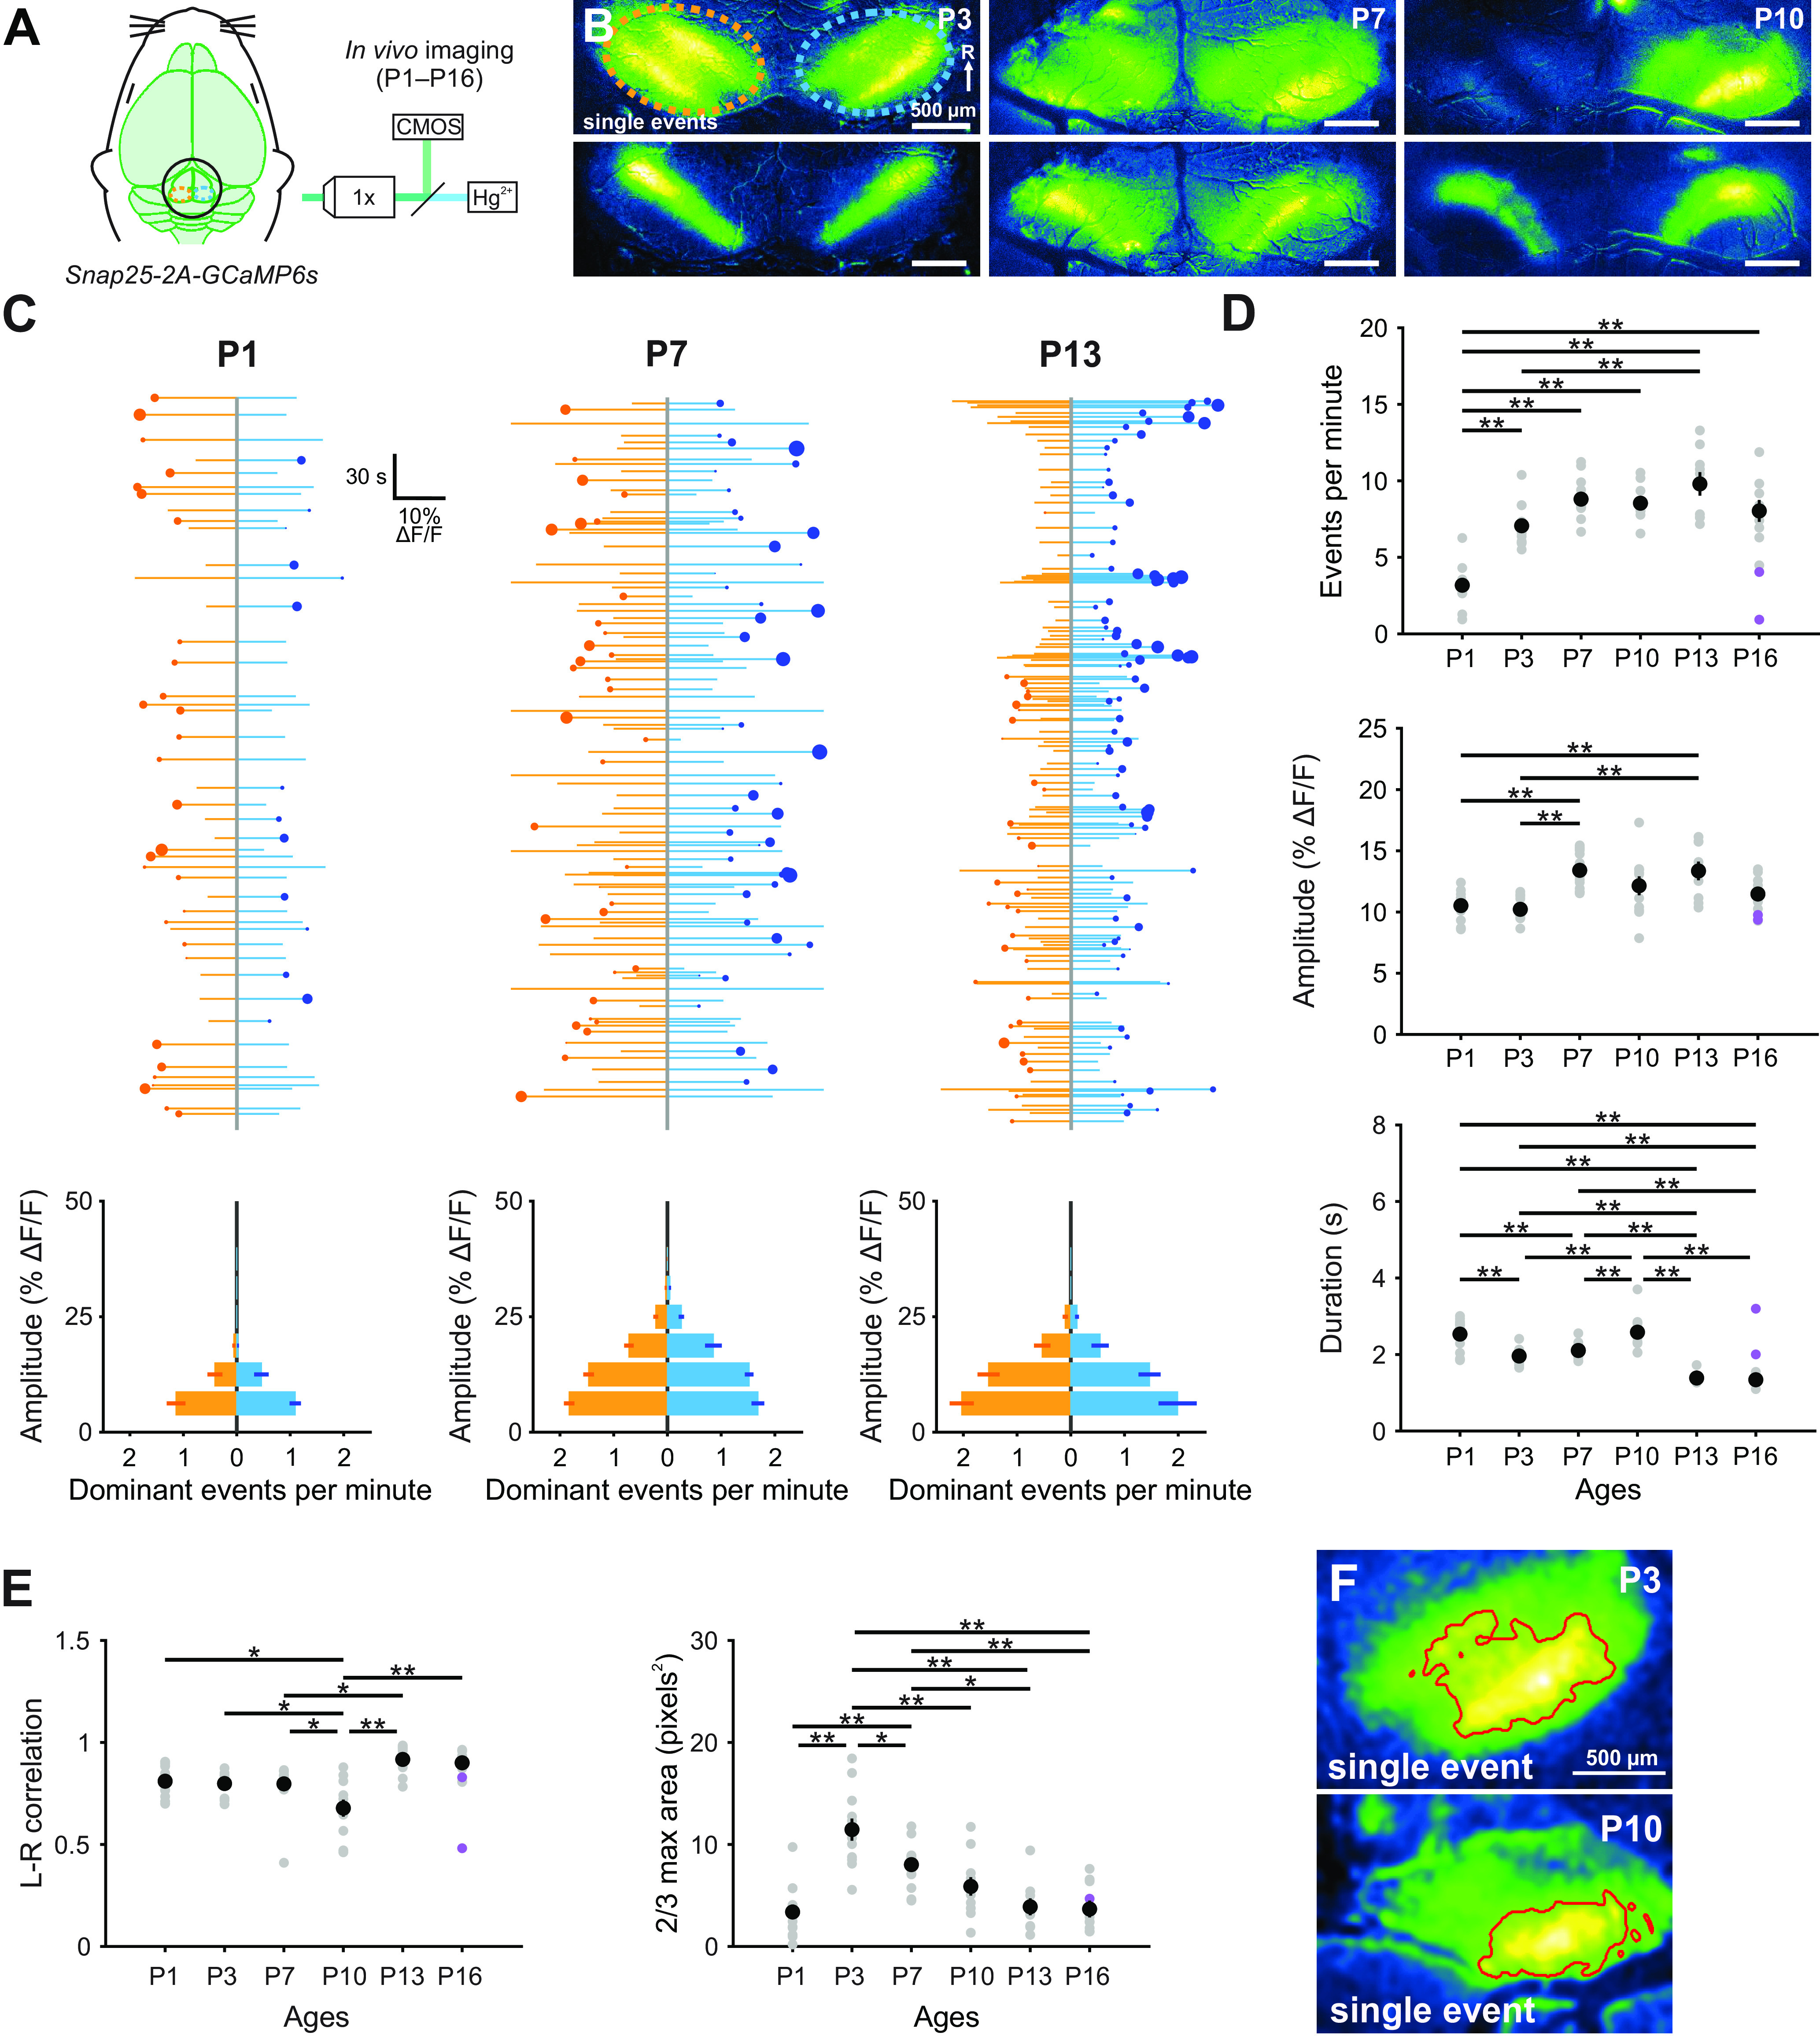
Figure 9.

Developmental increase in spontaneous activity in the IC. A, Spontaneous neural activity monitored in unanesthetized mouse pups (Snap25-T2A-GCaMP6s) with wide-field epifluorescence. B, Images of exemplar spontaneous Ca2+ transients in the auditory midbrain (IC) of unanesthetized Snap25-T2A-GCaMP6s mice (at P3, P7, and P10). Orange and blue ovals represent left and right IC, respectively, and correspond to ROIs used to examine fluorescence changes. Activity occurs within tonotopic bands (diagonal in each IC, rostral-lateral to caudal-medial), where single centrally located bands represent the lowest frequencies and lateral doublets represent progressively higher frequencies in mice after hearing onset (Babola et al., 2018). C, Graphs of activity over time for left (orange) and right (blue) lobes of the IC. Each line indicates an individual event. Circle represents which IC had the greater intensity. Size of dots indicates the difference in fluorescence between the two sides. Bottom, Histograms represent the number of dominant events per amplitude bin. D, Quantification of frequency, amplitude, and duration (half-width of events) of events across different ages. Purple data points indicate experiments performed with middle ear occluded. n = 13 P1, n = 12 P3, n = 15 P7, n = 11 P10, n = 9 P13, and n = 9 P16 mice. **p < 0.005 (one-way ANOVA with Tukey post hoc). Comparisons not explicitly shown were not statistically significant. E, Quantification of the left and right IC correlation coefficient (Pearson) and average area of each event (calculated as the area of pixels with values >2/3 × max intensity) across different ages. Purple data points indicate experiments performed with middle ear occluded. F, Example images of quantification of event areas (2/3 × max intensity delineated by red boundary) for single events.
