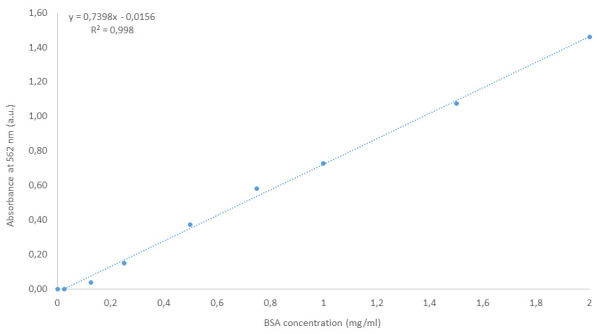
Figure 1. Example of calibration curve obtained for the bicinchoninic acid assay from BSA standards prepared as described here.

The equation of the linear regression as well as the corresponding R2 are mentioned on the graph.

The equation of the linear regression as well as the corresponding R2 are mentioned on the graph.