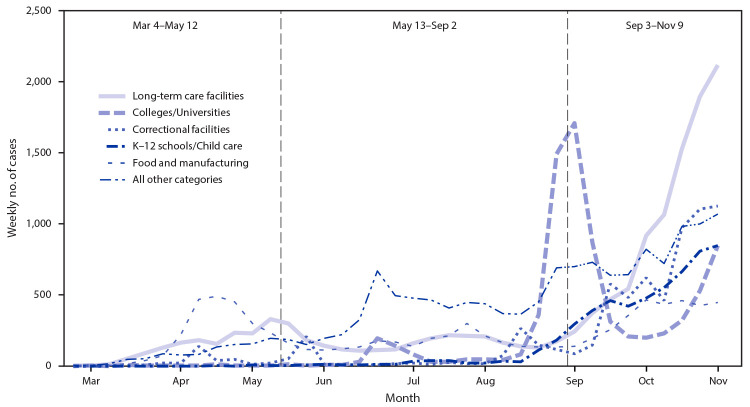
FIGURE.
Trends* in the number of laboratory-confirmed COVID-19 cases associated with outbreaks, by setting† and period of the COVID-19 response — Wisconsin, March–November 2020
Abbreviations: COVID-19 = coronavirus disease 2019; K–12 = kindergarten through grade 12.
* Data from November 10–16, 2020 are not displayed in the figure, but are represented in the counts that appear in text and footnotes.
† All other categories includes restaurant or bar (4.2%), retail or other public establishment (3.1%), event or gathering (3.0%), health care facility (2.8%), other group housing (2.2%), other workplaces (5.7%), and other settings (3.5%).

