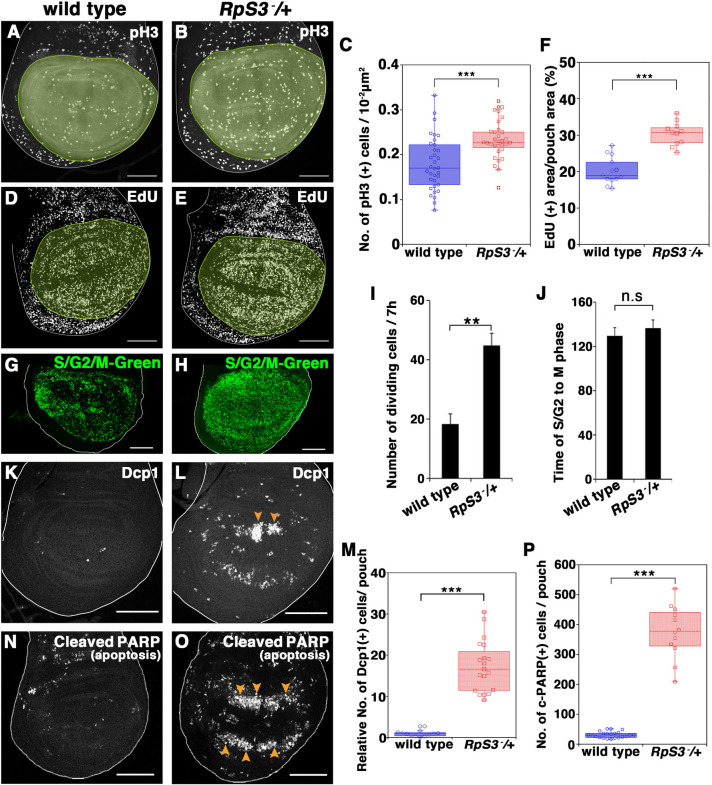
Fig 1. Massive cell-turnover occurs during wing development in M/+ animals.
(A and B) Wing disc of wild-type (A) or RpS3/+ (B) flies were stained with anti-phospho-histone H3 (pH3) (Ser10) antibody (white). Wing pouches were marked in pale green. Scale bar, 100 μm. (C) Boxplot with dots representing pH3 positive cells in the pouch in genotypes shown in (A) (n = 34, number of wing pouches) and (B) (n = 31). Error bars, SEM; ***, p<0.001; non-parametric Mann-Whitney U-test. (D and E) S-phase cells in the wing discs of wild-type (D) or RpS3/+ (E) flies were visualized by EdU staining (nuclei of proliferating cells) (white). Wing pouches were marked in pale green. Scale bar, 100 μm. (F) Boxplot with dots representing the EdU-positive area per wing pouch in genotypes shown in (D) (n = 13, number of wing pouches) and (E) (n = 11). Error bars, SEM; ***, p<0.001; non-parametric Mann-Whitney U-test. (G and H) Dividing cells were visualized by the S/G2/M-Green probe. Wing disc of nub-Gal4, UAS-S/G2/M-Green (G) or RpS3/+, nub-Gal4, UAS-S/G2/M-Green (H) is shown. Scale bar, 100 μm. (I) Quantification of the manually counted number of dividing cells in the wing pouch of genotypes shown in (G) (n = 7, number of wing pouches) and (H) (n = 10). Error bars, SEM; **, p<0.01; non-parametric Mann-Whiteney U-test. (J) Duration time (min) of S/G2 to M phase in cells in the wing pouch of wild-type (n = 19, number of wing pouches) or RpS3/+ (n = 42) larvae were manually measured. Time-laps imaging was performed for 7 hours. Error bars, SEM; n.s, not significant; non-parametric Mann-Whiteney U-test. (K and L) Dying cells in the wing disc were visualized by anti-Dcp1 antibody staining. Wing disc of wild-type (K) or RpS3/+ (L) is shown. Arrowheads indicate massive cell death occurred along the D/V axis in the wing pouch. Scale bar, 100 μm. (M) Boxplot with dots representing cleaved-Dcp-1-positive dying cells per pouch in genotypes shown in (K) (n = 12, number of wing pouches), and (L) (n = 19). Error bars, SEM; ***, p<0.001; non-parametric Mann-Whitney U-test. Scale bar, 100 μm. (N and O) The activated-caspase-3 indicator CD8-PARP-Venus was expressed in wild-type (N) or RpS3/+ (O) flies, and dying cells in the wing disc were visualized by anti-cleaved PARP staining (white). Arrowheads indicate massive cell death. The nuclei were visualized by DAPI staining (blue). Scale bar, 100 μm. (P) Boxplot with dots representing cleaved-PARP-positive dying cells per pouch in genotypes shown in (A) (n = 22, number of wing pouches) and (B) (n = 12). Error bars, SEM; ***, p<0.001; non-parametric Mann-Whitney U-test. Genotypes are as follows: nub-Gal4/+; UAS-CD8-PARP-Venus/+ (A, D), nub-Gal4, UAS-CD8-PARP-Venus, RpS3Plac92/+ (B, E), nub-Gal4/+; UAS-S/G2/M-Green/+ (G), nub-Gal4/+; UAS-S/G2/M-Green/RpS3Plac92 (H), w1118 (K), FRT82B, Ubi-GFP, RpS3Plac92/+ (L), Actin-Gal4, UAS-CD8-PARP-Venus/+ (N), and Actin-Gal4, UAS-CD8-PARP-Venus/FRT82B, Ubi-GFP, RpS3Plac92 (O).

