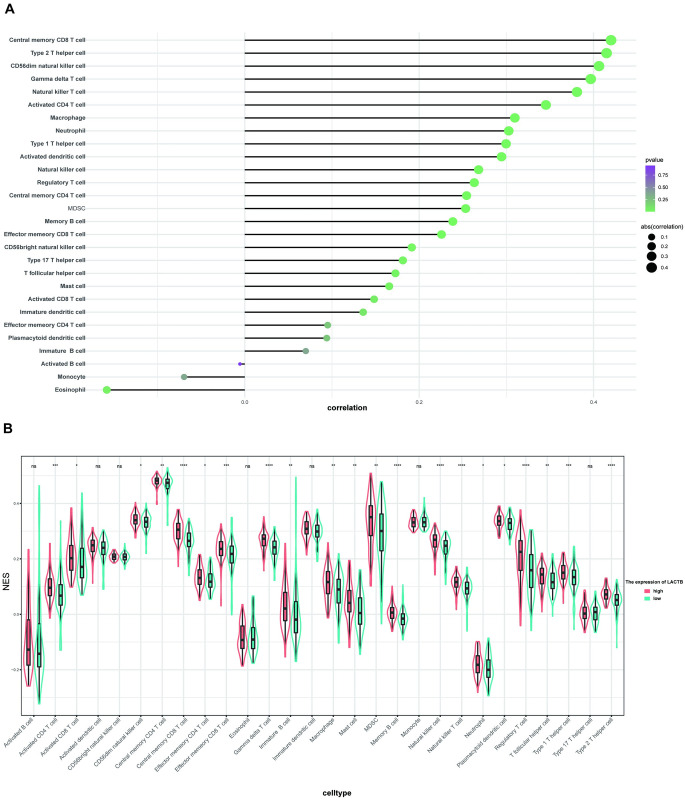
Fig 6. The ssGSEA function in the gsva R package was used in combination with a signature matrix of 28 immune cell types to calculate the NES of different infiltrating immune cells among patients with different LACTB mRNA expression statuses.
Most immune cells correlated with LACTB expression (P<0.05) (A), and the high LACTB mRNA expression subgroup had a significantly high NES of most immune cell subtypes (B).

