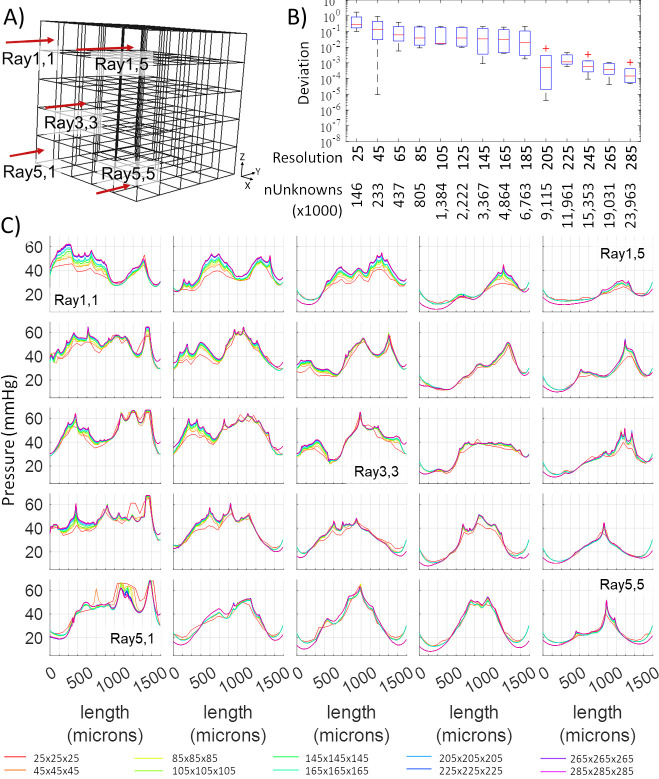
Fig 3. Tracing of oxygen tension across 25 rays penetrating the tissue domain (raytracing analysis) for an empirical network (specimen E4.1).
A) 3D Cartesian tissue mesh and location of 25 rays to examine the variability of tissue tension as a function of grid resolution. B) Statistics of deviations of the computed oxygen profiles from the reference solution (= the finest grid with a resolution of 305x305x305 elements per volume corresponding to ~29M cells). C) Simulated oxygen profiles as a function of 15 grid resolutions along 25 rays through the domain. The oxygen simulations stabilize well below the highest resolution. Specifically, results become mesh independent at 205x205x205 domain (resolution = 205) which corresponds to ~9.115M unknowns.

