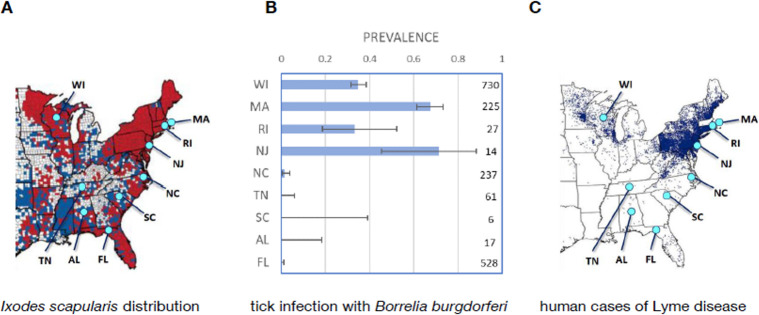
Fig 1. Locations of study sites and tick infection prevalence.
(A) Map of distribution of Ixodes scapularis ticks; red counties have tick populations that are considered established (at least 6 ticks or at least 2 of the host-seeking life stages had been identified in a single collection period), and blue counties have at least some tick collections, but establishment has not been demonstrated [2]. (B) Infection prevalence in host-seeking adult I. scapularis with binomial 95% confidence intervals (from current study; number to the right of each bar is the number of ticks tested to provide that infection prevalence value). (C) Map of human cases of Lyme disease in the eastern and central US in 2018 (CDC map; each dot indicates 1 case of Lyme disease, placed randomly in the patient’s county of residence; https://www.cdc.gov/lyme/stats/maps.html). Maps in Fig 1A and 1C are from the CDC, and data in Fig 1B are available in S1 Data. CDC, Centers for Disease Control and Prevention.

