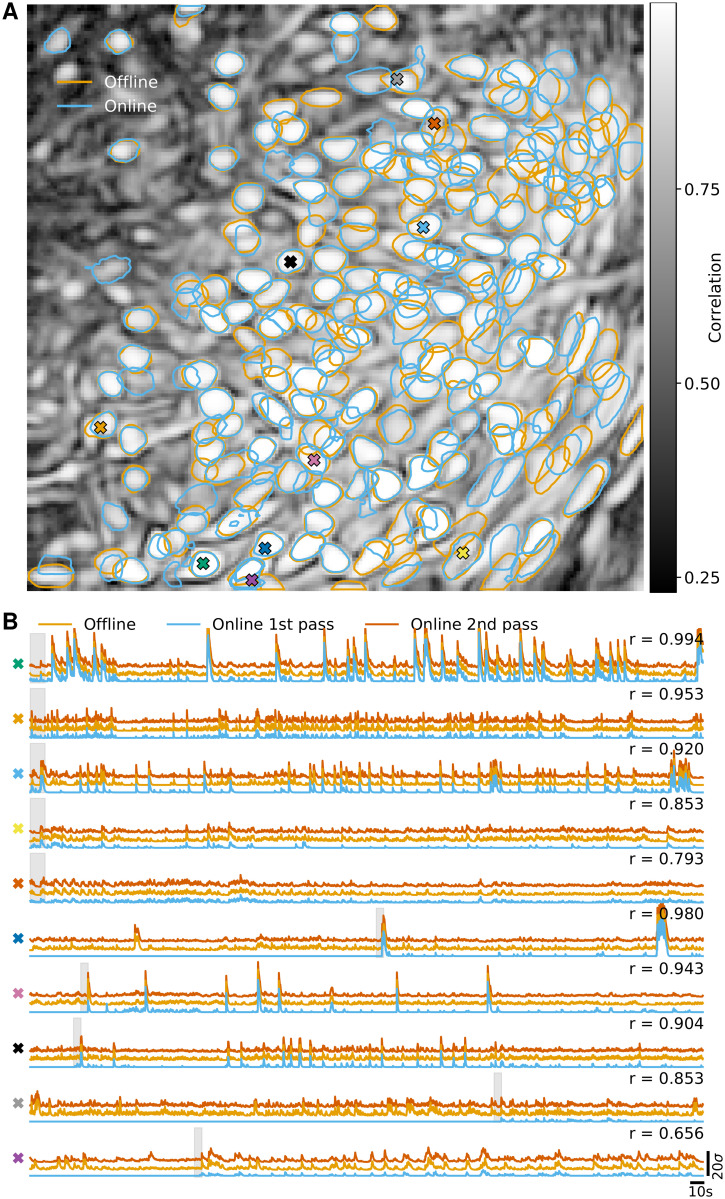
Fig 3. Comparison of OnACID-E with CNMF-E on data from neurons expressing GCaMP6s recorded in vivo in mouse prefrontal cortex.
(A) Contour plots of all neurons detected by CNMF-E using patches (orange) and OnACID-E (blue), overlaid over the local cross-correlation image. Colors match the example traces shown in (B), which illustrate the temporal components of ten example neurons detected by both implementations. The gray shaded area shows the mini-batch OnACID-E used for the cell’s initialization, thus the area’s right border indicates at what frame the cell was initialized. The numbers to the upper right of each trace shows the correlation r between ‘offline’ and ‘online 2nd pass’.

