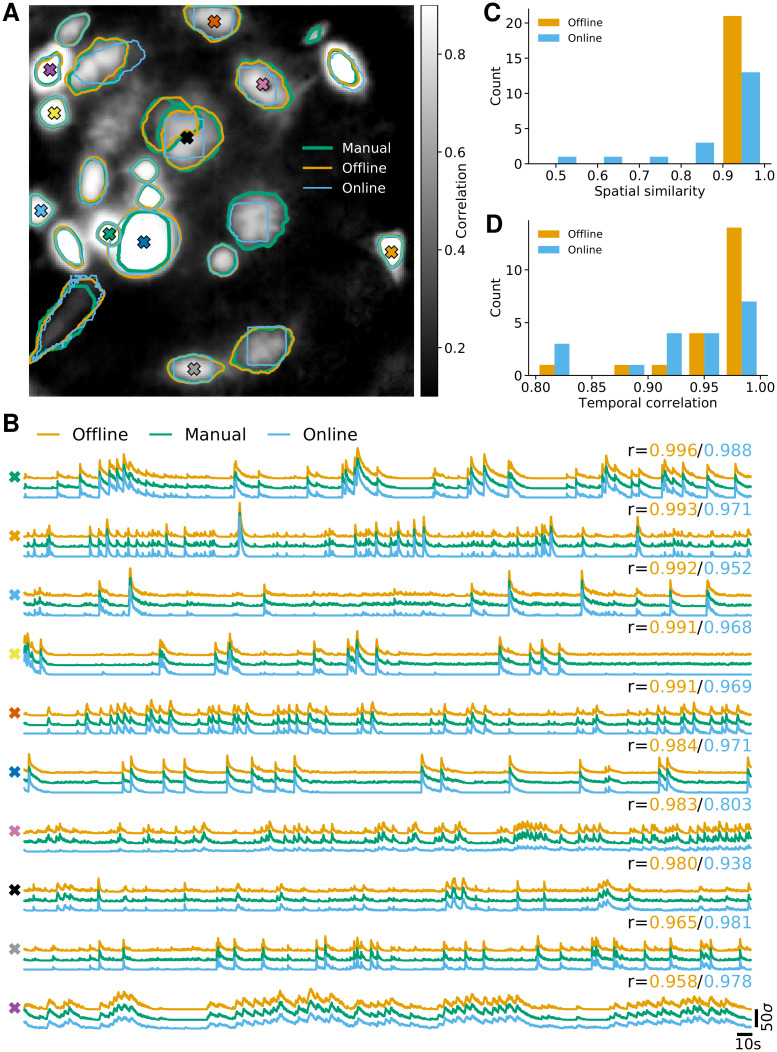
Fig 4. Comparison of OnACID-E with CNMF-E on data from neurons expressing GCaMP6f recorded in vivo in mouse ventral hippocampus.
(A) Contour plots of ground truth neurons (green) as well as all neurons detected by CNMF-E (orange) and OnACID-E (blue), overlaid over the local cross-correlation image of the background-subtracted video data, with background estimated using CNMF-E with manual labeling. Colored symbols match the example traces shown in (B), which illustrate the temporal components of ten example neurons detected by both implementations. The numbers to the upper right of each trace shows the correlation r between ‘offline’/ ‘online’ and ‘manual’. (C) Histogram of cosine similarities between inferred and true neural shapes. (D) Histogram of correlations between inferred and true neural fluorescence traces.

