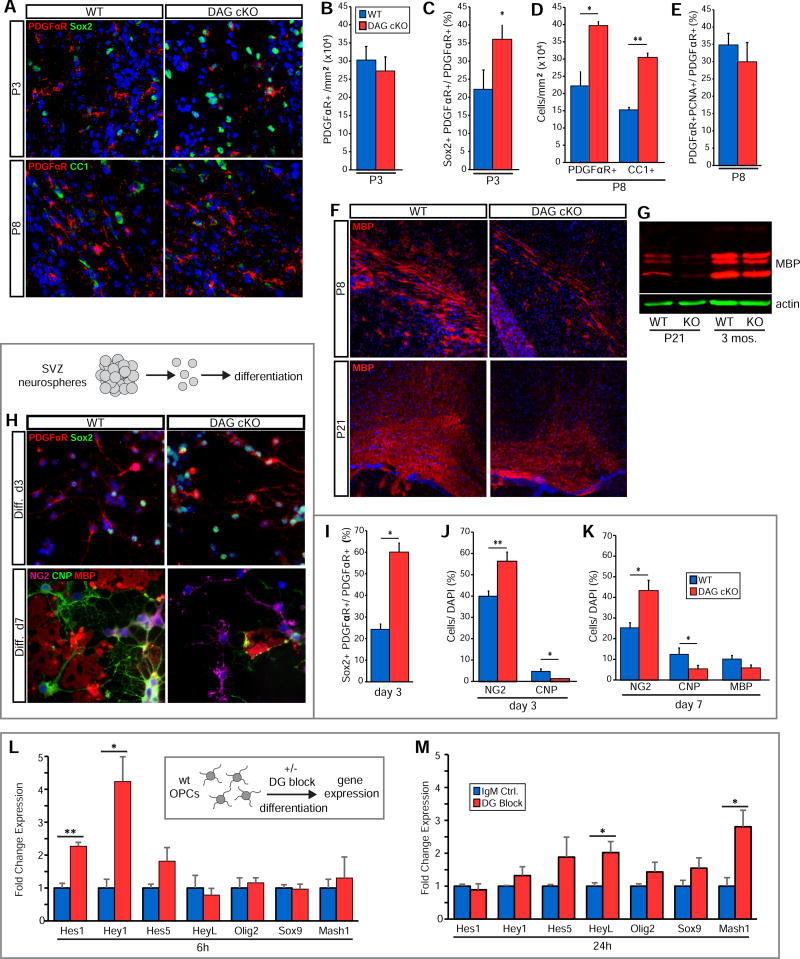
Figure 6. Dystroglycan Promotes Timely Oligodendrocyte Lineage Progression.
(A) IHC to detect PDGFRα, Sox2, and CC1 in the corpus callosum in coronal sections from P3 and P8 WT and DAG cKO mice. (B) Quantification of PDGFRα+ OPC densities in the P3 corpus callosum (error bars, SEM; n=3). (C) Quantification of Sox2+ cells within PDGFRα+ cell population in the P3 corpus callosum (*p<0.05, Student’s t-test; error bars, SEM; n=3). (D) Quantification of PDGFRα+ and CC1+ cell densities in the P8 corpus callosum (*p<0.05, **p<0.01, Student’s t-test; error bars, SEM; n=3). (E) Quantification of OPC proliferation in the P8 corpus callosum (error bars, SEM; n=3). (F) IHC to detect myelin basic protein (MBP) in the corpus callosum in coronal sections from P8 and P21 WT and DAG cKO mice. (G) Western blot to detect MBP protein in cortical lysates obtained from WT and DAG cKO mice at P21 and 3 months. (H) WT and DAG cKO cells were dissociated from second passage neonatal SVZ neurospheres and differentiated on PDL. IHC was used to detect PDGFRα and Sox2 at differentiation day 3, or NG2, CNP, and MBP at differentiation day 7. (I) Quantification of Sox2+ cells within the PDGFRα+ cell population at day 3 in differentiation medium (*p<0.05, Student’s t-test; error bars, SEM; n=3). (J) Quantification of OPCs (NG2+) and OLs (CNP+) at day 3 in differentiation medium (*p<0.05, **p<0.01, Student’s t-test; error bars, SEM; n=7). (K) Quantification of OPCs (NG2+), OLs (CNP+) and myelin-competent OLs (MBP+) at day 7 in differentiation medium (*p<0.05, Student’s t-test; error bars, SEM; n=4). (L) Wild-type oligodendrocyte progenitor cells (OPCs) were plated on PDL in differentiation-permissive medium in the presence of dystroglycan-blocking (DG block) or control antibodies and evaluated 6 hours later for mRNA levels of Notch-regulated genes, Hes1 and Hey1 (*p<0.05, **p<0.01, Student’s t-test; error bars, SEM; n=6). (M) Treatment of OPCs as in L but analyzed at 24 hours (*p<0.05, , Student’s t-test; error bars, SEM; n=6). Scale bars: 50 µm (A,L), 100 µm (F).

