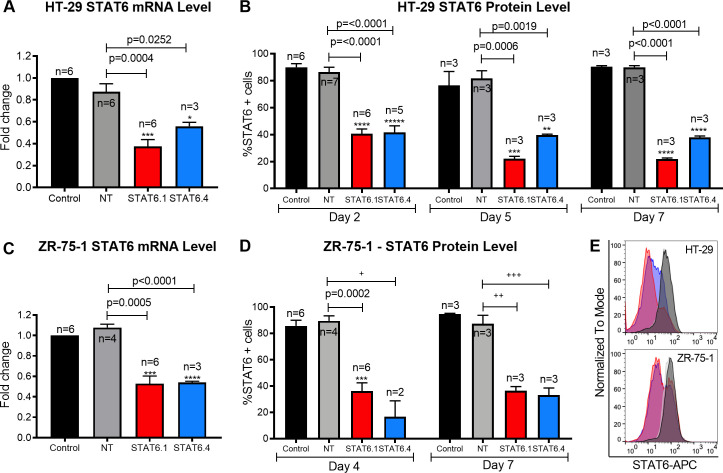
Fig 1. STAT6 siRNA sequences 1 and 4 significantly block STAT6 expression.
(A) Measure of STAT6 mRNA level in HT-29 cells 24 hours post-transfection. The graph represents the mean ± SEM of multiple independent experiments (n) obtained by real-time PCR. Results were analysed by ΔΔCt method for relative quantifications. The fold change is represented by the Y axis, and values are normalized to control cells. (B) STAT6 protein level analysis at 2, 5 and 7 days post- transfection in HT-29 cells. The graph represents the mean of the percentage of STAT6 positive cells ± SEM of multiple independent experiments (n) obtained by flow cytometry. (C) Measure of STAT6 mRNA level in ZR-75-1 cells 3 days post-transfection. The graph represents the mean ± SEM of multiple independent experiments (n) obtained by real-time PCR. Results were analysed by ΔΔCt method for relative quantifications. The fold change is represented by the Y axis, and values are normalized to control cells. (D) STAT6 protein level analysis after 4 and 7 days of transfection in ZR-75-1 cells. The graph represents the mean of the percentage of STAT6 positive cells ± SEM of multiple independent experiments (n) obtained by flow cytometry. +: n is too small to test normality and equality of variances. The p-value for a t-test is 0.0015, but p = 0.0801 for unequal variances (Welch´s correction) and p = 0.1333 for non-parametric tests (unpaired two-tailed Mann Whitney test). The significance of the result must be considered with caution. ++: The p-value for a t-test is 0.02, but, for non-parametric samples, p = 0.1 for an unpaired two-tailed Mann Whitney test. The significance of the result must be considered with caution. +++: The p-value for a t-test is 0.003 but, for non-parametric samples, p = 0.1 for an unpaired two-tailed Mann Whitney test. The significance of the result must be considered with caution. E) Representative histograms (Control: back; NT: grey; STAT6.1: red; STAT6.4: blue) of STAT6 protein analysis at 7 days post-transfection by flow cytometry in HT-29 cells (top) and ZR-75-1 (bottom) cells. STAT6 siRNA sequences and non-targeting siRNA were used at 100 nM as the final concentration. Control cells were non-transfected cells and STAT6 siRNA sequences 1 and 4 and non-targeting siRNA are denoted as STAT6.1, STAT6.4 and NT, respectively. The number of independent experiments (n) is set out in the Fig.

