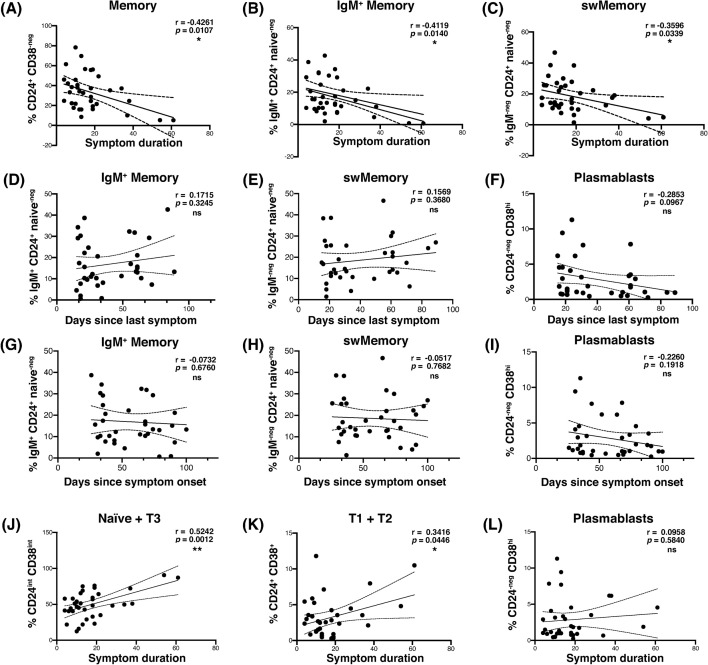
Fig 2. The frequency of memory B cells in the peripheral blood was correlated with shorter symptom duration following infection with SARS-CoV-2, and stable over time.
(A-C) Scatterplot correlation of symptom duration in days, vs. the frequency among viable CD19+ B cells of (A) total memory, (B) IgM+ memory, and (C) switched memory. (D-F) Scatterplot correlation of days since last symptom vs. (D) IgM+ memory, (E) switched memory, and (F) plasmablast frequency among viable CD19+ lymphocytes. (G-I) Scatterplot correlation of days since symptom onset vs. (G) IgM+ memory, (H) switched memory, and (I) plasmablast frequency among viable CD19+ B cells. (J-L) Scatterplot correlation of symptom duration in days, vs. (J) naïve and transitional type 3, (K) transitional type 1 and 2, and (L) plasmablast frequency among viable CD19+ B cells. Pearson’s correlation r value and 95% confidence intervals shown with two-tailed p values, alpha = 0.05. n = 35 (all symptomatic subjects) for all.

