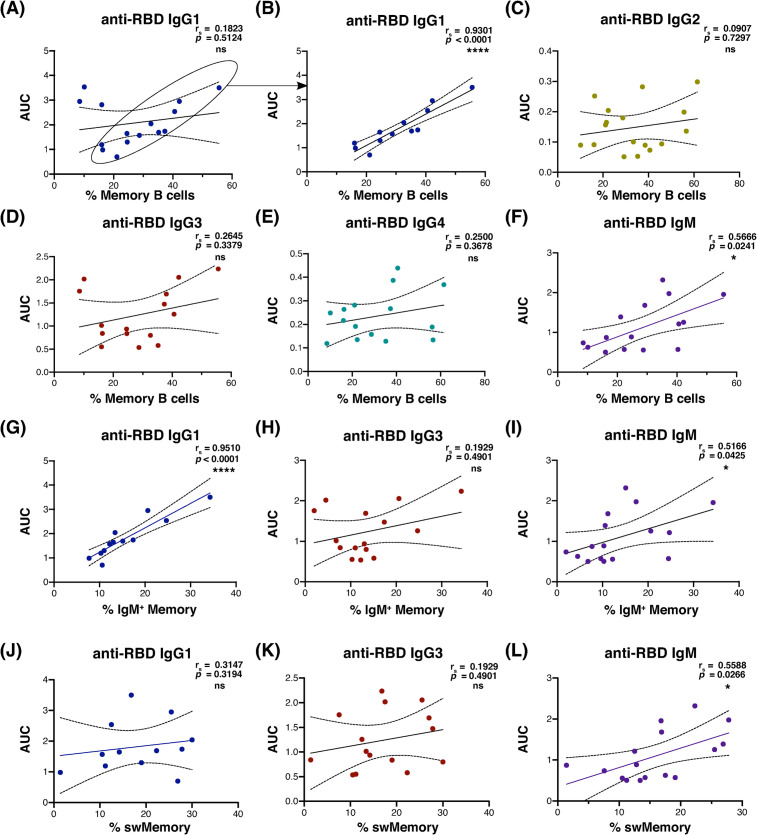
Fig 3. Anti-spike RBD antibody levels correlated with memory B cell frequency in most seropositive convalescent plasma donors.
(A-F) Correlation of area under the curve for anti-RBD plasma absorbance vs. memory B cell frequency from convalescent subjects seropositive for each isotype (IgG1 & IgG3 n = 15, IgM n = 16). Subjects whose data points are circled in (A) were isolated from apparent outliers for statistical analysis of IgG1 in (B, G, and J; n = 12). (G-I) Scatterplot correlation of area under the curve for anti-RBD plasma absorbance vs. IgM+ memory B cell frequency among viable CD19+ lymphocytes. (J-L) Correlation of area under the curve for anti-RBD plasma absorbance vs. switched memory B cell frequency among viable CD19+ lymphocytes. Spearman’s correlation rs value and 95% confidence intervals shown with two-tailed p value, alpha = 0.05 for all analyses. Regression lines shown to demonstrate trend only. Sample number distribution was the same between total, IgM+ and switched memory B cell analyses.

