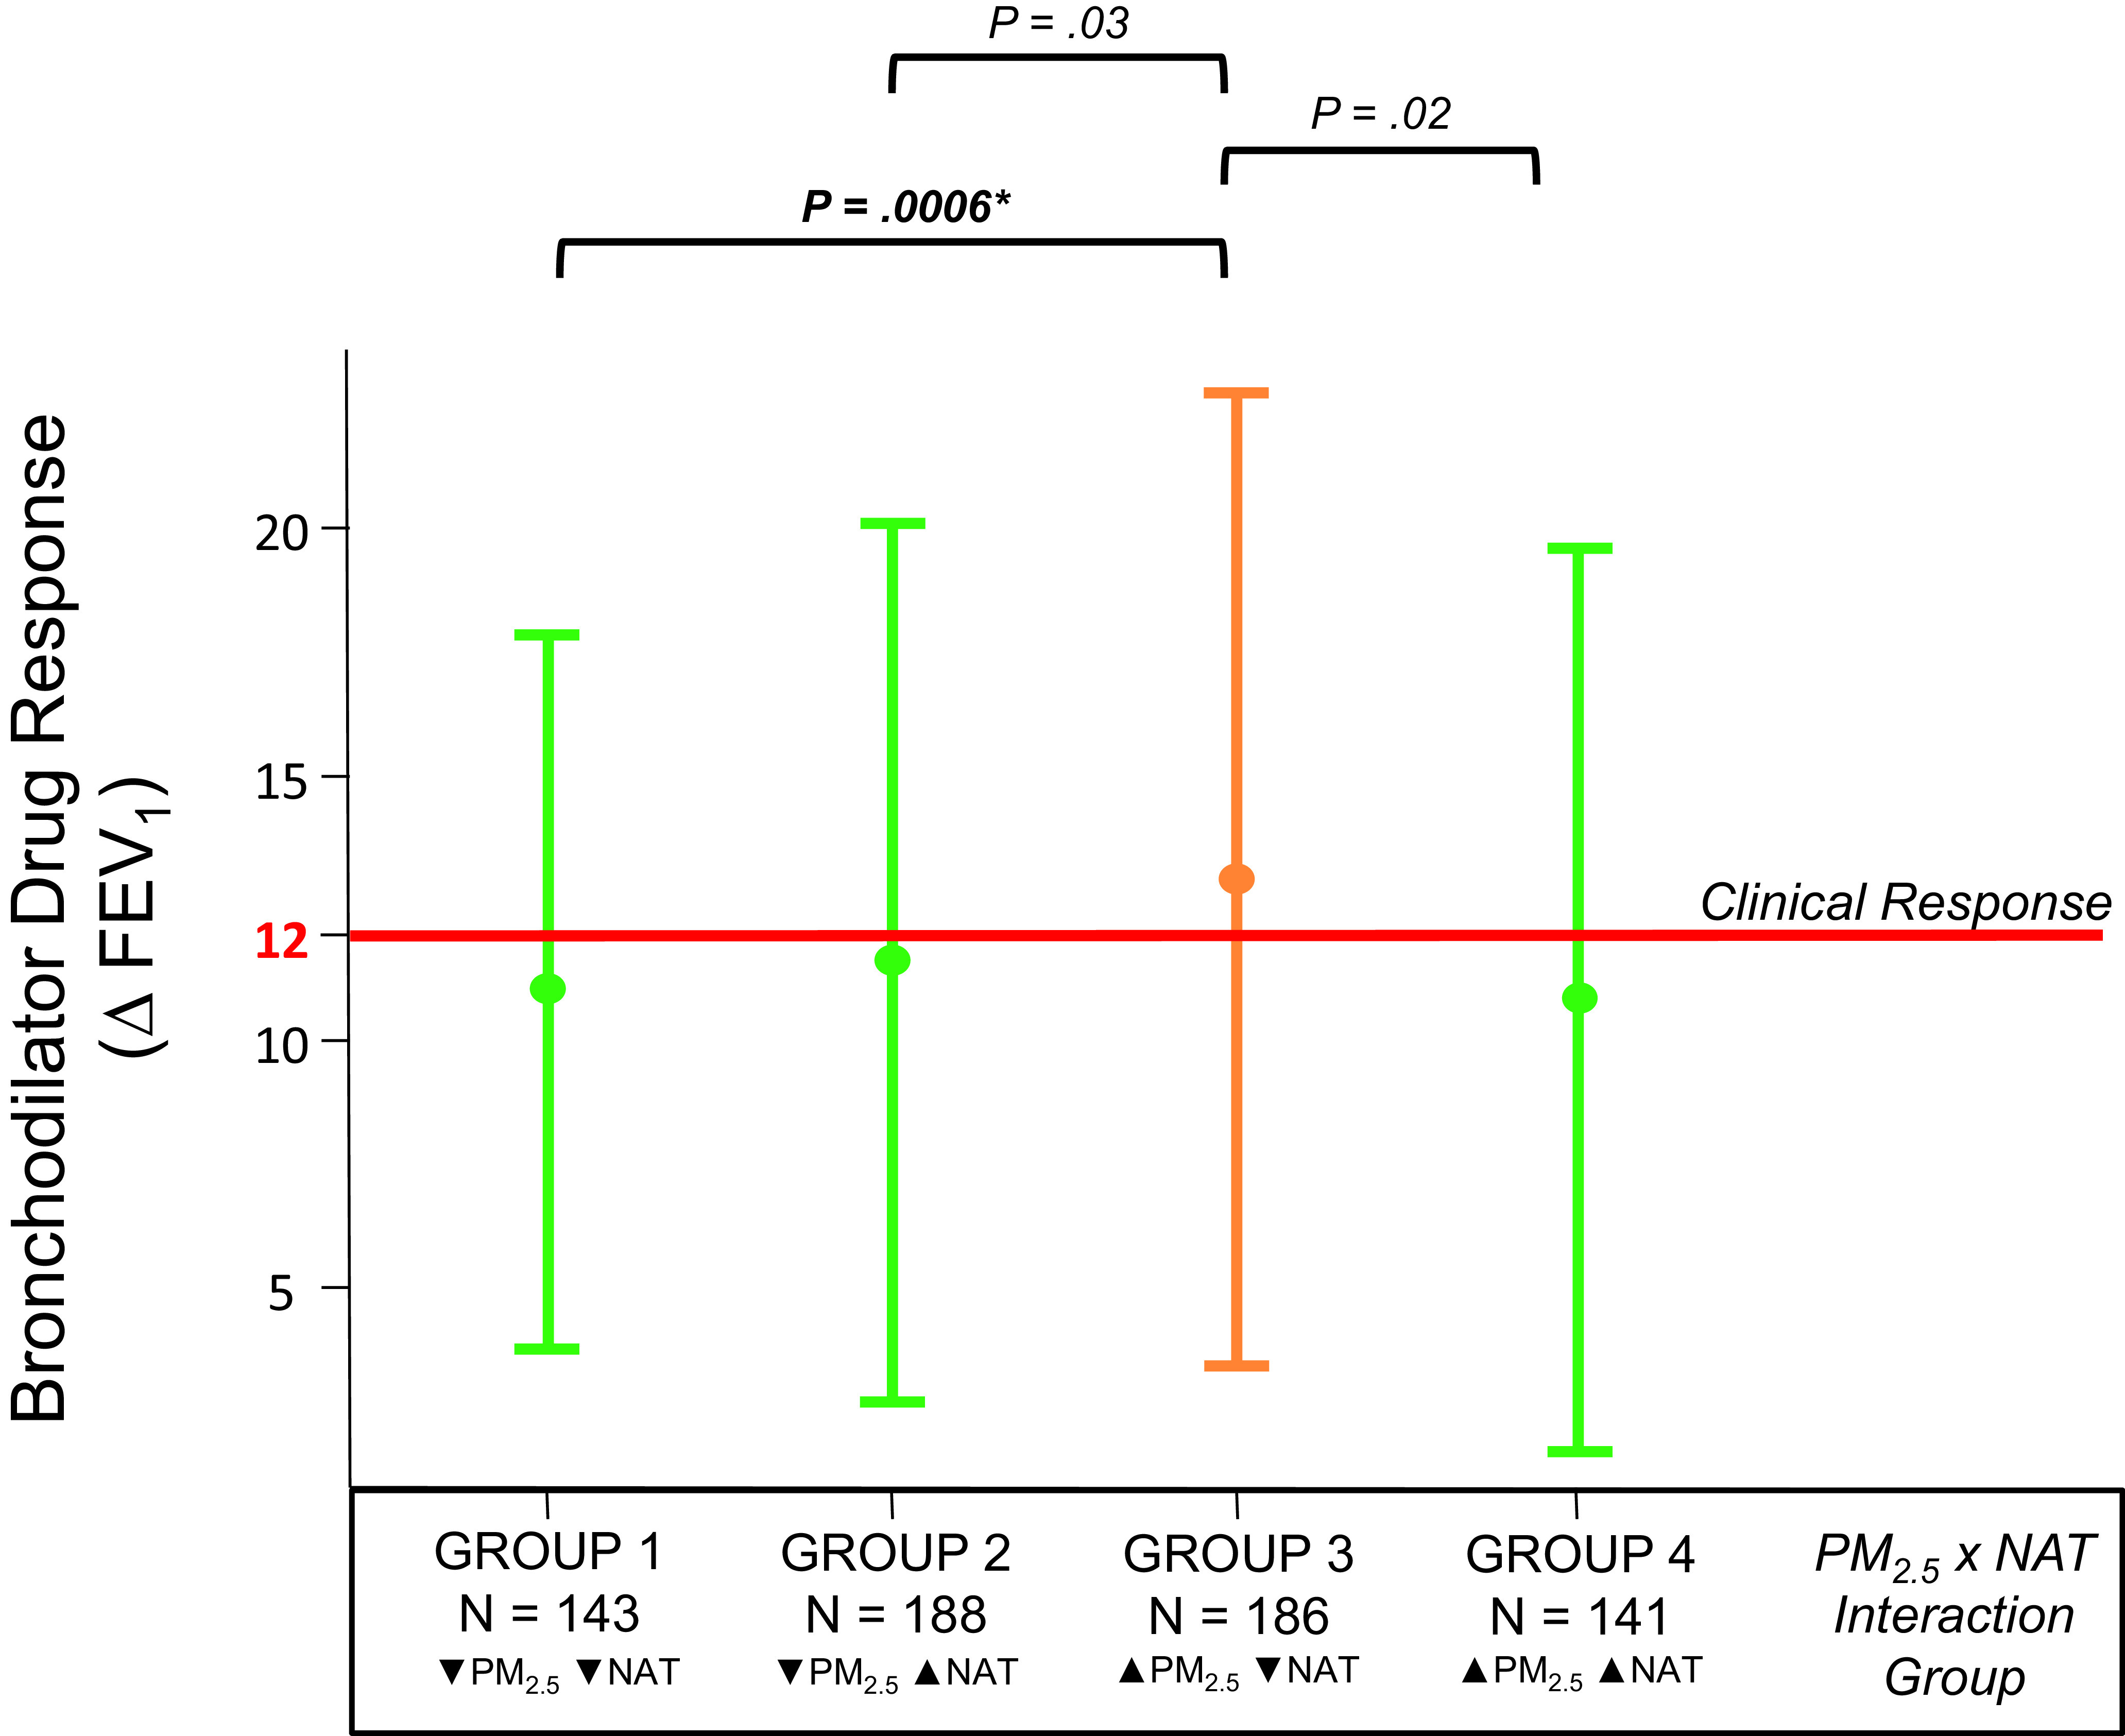
Figure 2. Variation in bronchodilator drug response by PM2.5 x NAT interaction group.

Error plot graph of bronchodilator drug response by PM2.5 x NAT interaction group membership. Vertical lines denote the interquartile range (IQR) of group data; circles indicate the group median. Orange lines indicate groups that achieved clinically significant BDR (∆ FEV1 ≥ 12%). Ps presented here are from the Dunn Test of differences between groups; black brackets indicate the groups being compared. P-values in bold remained significant after correction for Bonferroni correction for multiple testing. ∆ FEV1 is the difference in % of Predicted FEV1 achieved before and after bronchodilator treatment. ▼ means that the group median < study population median; ▲ means that the group median ≥ study population median. PM2.5 denotes exposure to particulate matter, while NAT indicates Native American genetic ancestry. FEV, forced expiratory volume.
