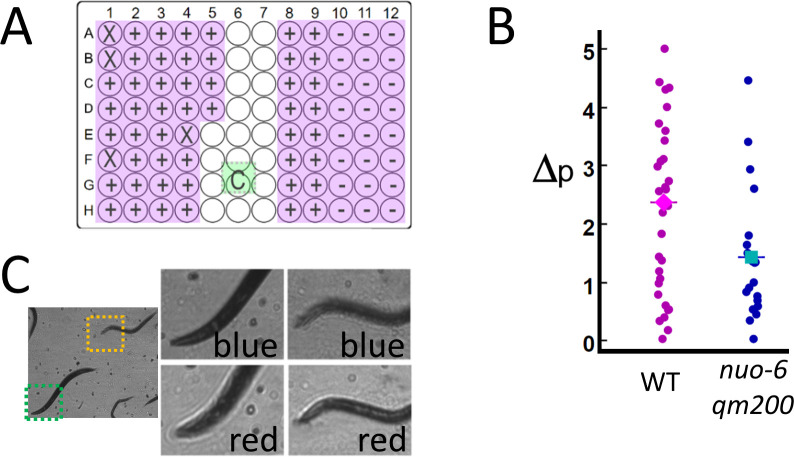
Figure 3. High-throughput estimates of C. elegans motion in liquid media.
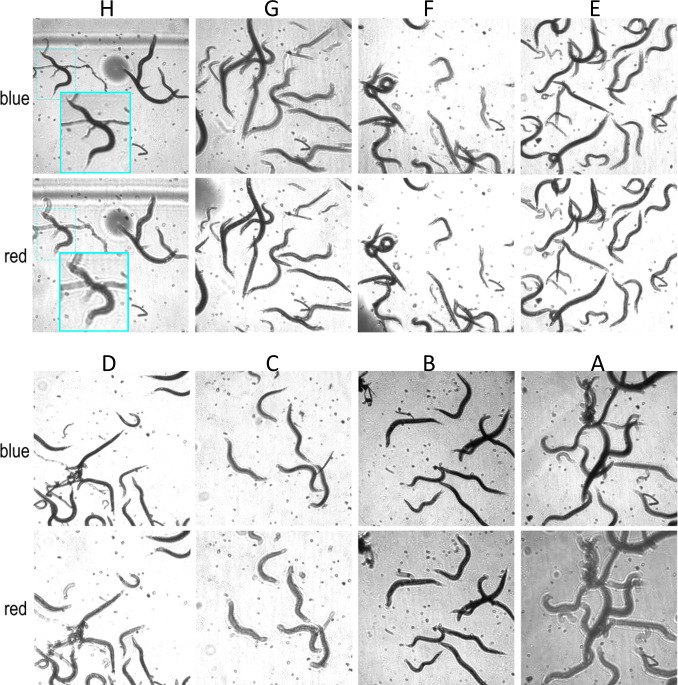
Images are captured at 120 fps, which is split over multiple wells as shown in Video 1. (A) The position of the active detection sites (magenta) relative to the camera (green), which obscures a portion of the 96-well plate: Wells obscured by hardware are denoted by an ‘X’ symbol (see Materials and methods: Table 1), wells with wild-type C. elegans (WT, ‘+’ symbol) and mutant (nuo-6(qm200), ‘−’ symbol). (B) Motion analysis comparing wild type (magenta dots) to mitochondrial mutant nuo-6(qm200) (blue dots): wells in each row are imaged in parallel (eight wells at 15 fps per well), and net motion is estimated in each well by summing absolute differences in pixel intensities in sequential frames (see Materials and methods: Image analysis). This estimate confirms that the imaging system can detect significant differences between the two strains (averages shown by diamond and square symbols, two-tailed t-test p=0.01), which is consistent with published results (Yang and Hekimi, 2010). (C) Focal plane wavelength dependence: details from two fields of view (dashed green and orange squares) in the same image appear in or out of focus depending on whether imaged using a red or blue LED (see Video 2 and Figure 3—figure supplement 1).


