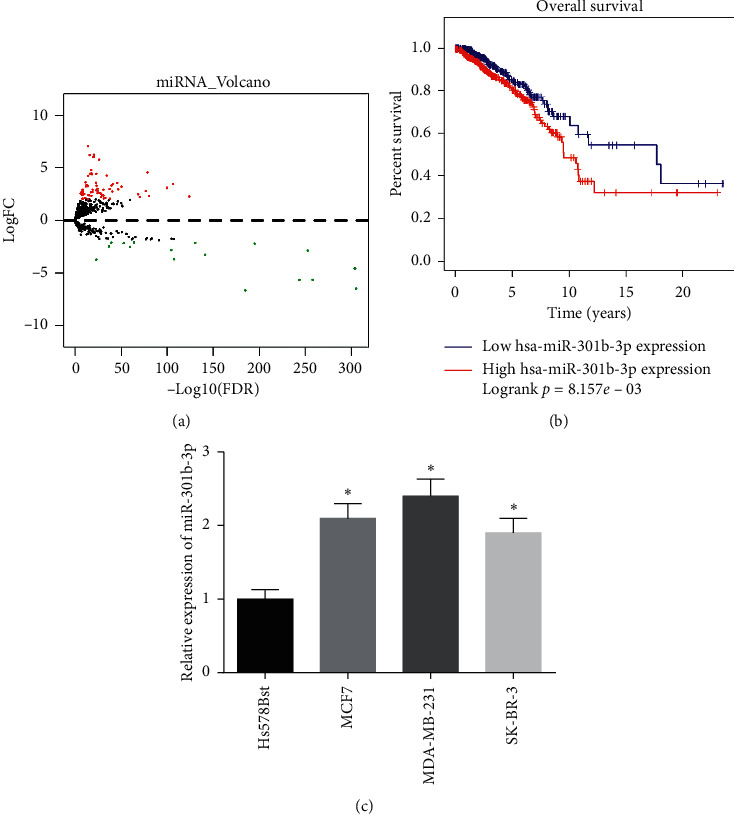
Figure 1.

Upregulation of miR-301b-3p in human breast cancer: (a) differential gene volcano map of miRNA in TCGA-BRCA (red indicates upregulated miRNA, and green indicates downregulated miRNA); (b) survival curve of miR-301b-3p gene (red curve indicates high expression, and blue curve indicates low expression); (c) the expression level of miR-301b-3p in normal breast cells and breast cancer cell lines (∗,p < 0.05).
