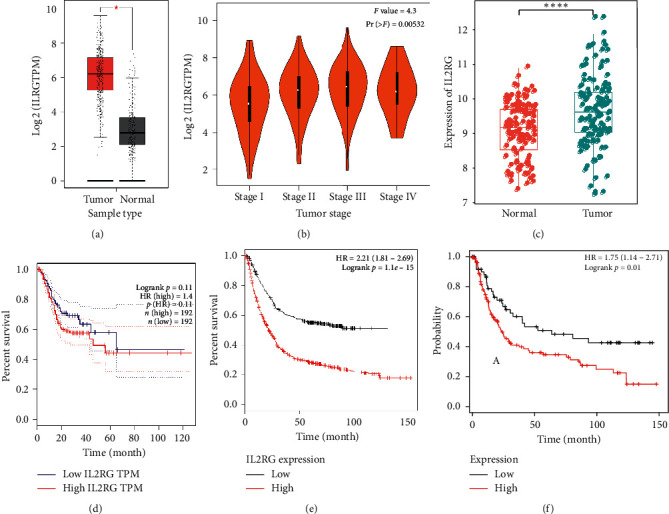
Figure 3.

IL2RG expression level and survival analysis. (a) IL2RG expression levels in tumor tissues and normal tissues (stomach adenocarcinoma, STAD). IL2RG gene expression level was significantly elevated in tumor tissues T (n = 408) compared to the paracancerous tissues N (n = 211). ∗p=1.1e − 15. (b) The correlation of the expression level of IL2RG and the cancer pathologic stage (TCGA data analysis in GEPIA). (c) IL2RG expression levels in normal and tumor samples in the GSE29272 dataset. ∗∗∗∗p < 0.001. (d) Relapse-free survival analysis of IL2RG in gastric cancer based on TCGA data analysis in GEPIA. HR: hazard ratio. (e) Kaplan–Meier curves showed a strong correlation of the IL2RG expression and overall survival rate. TPM, transcripts per million. (f) Overall survival curve of patients with high and low expression levels of IL2RG in the GSE15459 dataset.
