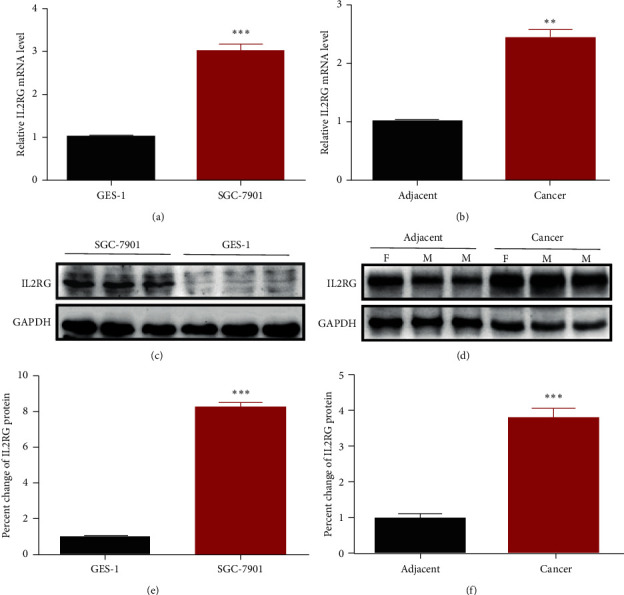
Figure 4.

Western blotting and RT-qPCR showing the IL2RG expression levels in gastric tissues and gastric cell line. (a), (b) mRNA levels of IL2RG in SGC-7901 cells and GES-1 cells and cancer tissues and paracancerous tissues, respectively. (c), (d) Representative electrophoresis bands of western blots for IL2RG protein expression in SGC-7901 cells and GES-1 cells, as well as in cancer tissues and paracancerous tissues, respectively. GAPDH was loading control. (e), (f) statistical protein levels of IL2RG in SGC-7901 cells and GES-1 cells, as well as in GC tissues and paracancerous tissues. ∗∗p < 0.01,∗∗∗p < 0.001 vs. GES-1 cells or adjacent normal gastric tissues.
