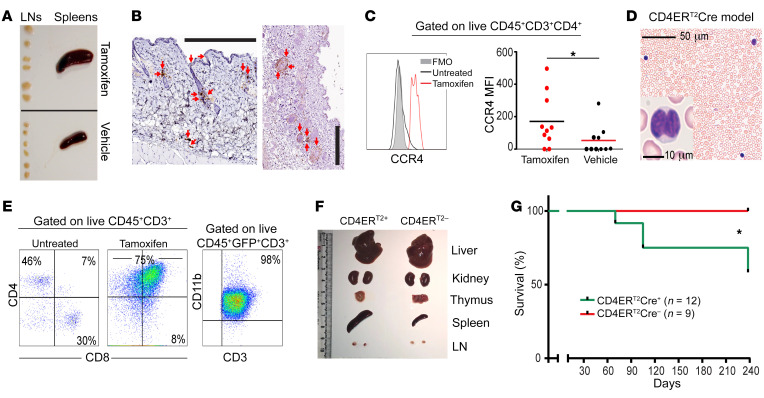
Figure 4. Satb1 ablation and Notch activation cooperate to transform postthymic CD4+ T lymphocytes into skin-homing lymphoma cells.
(A) Splenomegaly and adenopathy in a CD4CreERT2Satb1fl/flRosa26N1-ICD mouse 2 months after tamoxifen-mediated activation of transgenes. Representative differences in the size of lymph nodes (LNs) and spleens from different CD4CreERT2Satb1fl/flRosa26N1-ICD mice injected with tamoxifen (n = 9) versus corn oil (vehicle control) (n = 9). (B) Accumulation of CD3+ T cells (red arrows) in the skin of CD4CreERT2Satb1fl/flRosa26N1-ICD mice, 10 weeks after tamoxifen administration. Scale bar: 300 μm. (C) Representative histogram analysis (left) and median fluorescence intensity (MFI, right) of the expression of CCR4 in CD3+CD4+ T cells in the peripheral blood of CD4CreERT2Satb1fl/flRosa26N1-ICD mice, treated with tamoxifen (n = 10) versus corn oil (n = 10). Two-tailed Student’s t test: *P < 0.05. (D) Representative Giemsa staining of peripheral blood in the same mice. Scale bar: 50 μm. A detail of a cerebriform cell is also shown. Scale bar: 10 μm. (E) Expansion of CD4+CD8+CD11b+ T cells in the peripheral blood of CD4CreERT2Satb1fl/flRosa26N1-ICD mice 10 weeks after tamoxifen challenge. (F) Splenomegaly and adenopathy in a CD4CreERT2Satb1fl/flRosa26N1-ICD mouse 2 months after tamoxifen-mediated activation of transgenes. Representative differences in the size of LNs and spleens from different CD4CreERT2Satb1fl/flRosa26N1-ICD versus CD4CreERT2-negative mice. (G) Survival curve of CD4CreERT2Satb1fl/flRosa26N1-ICD mice (n = 12) versus mice without CD4CreERT2 (n = 9). Log-rank (Mantel-Cox) test: *P < 0.05.

