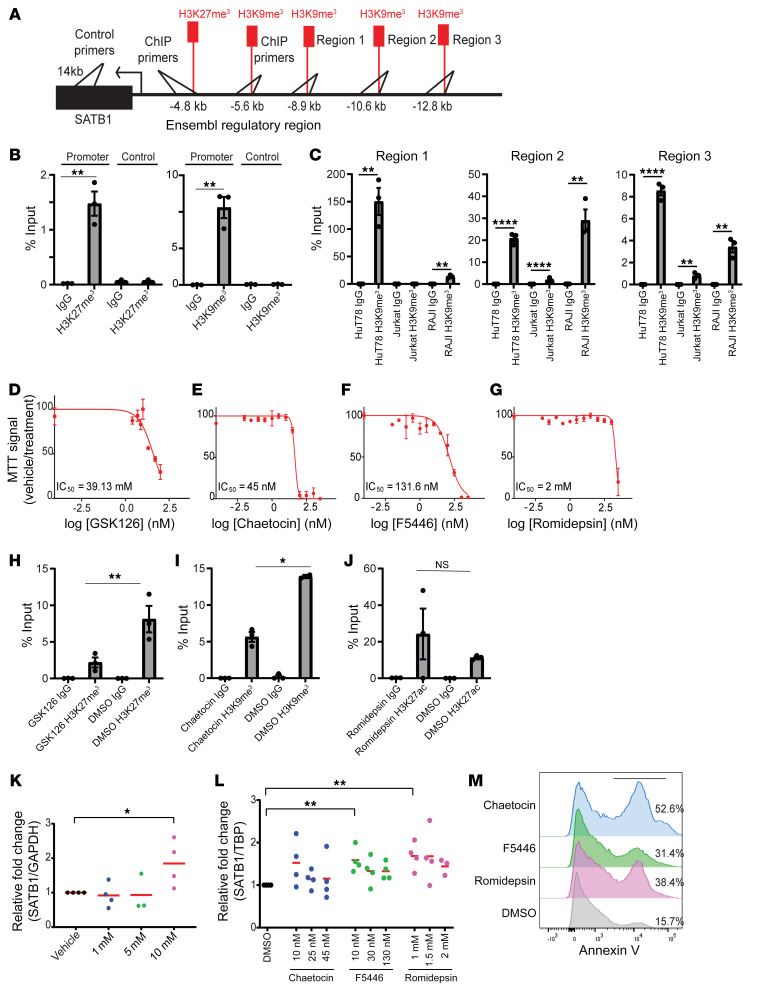
Figure 6. H3K27me3 and H3K9me3 occlude the SATB1 promoter in a Sézary cell line.
(A) Schematic depiction of primer sites for the regulatory and control regions for ChIP-PCR analysis in B and C. (B) ChIP quantified by real-time q-PCR with anti-H3K27me3 (clone C36B11) (left) or anti-H3K9me3 (Abcam, ab8898) (right) versus the control region (approximately 14 kb from promoter) and control IgG pull-downs from HuT78 Sézary cells calculated against 2.5% input values. Regions amplified at predicted occupied region approximately 4.8 kb for H3K27me3 and approximately 5.6 kb for H3K9me3 from SATB1 promoter. Representative of 2 independent experiments. (C) ChIP quantified by real-time qPCR with anti-H3K9me3 (ab8898) and control IgG pull-downs from HuT78, Jurkat, and RAJI cells lines calculated against 2.5% input values. Regions amplified based on ChIP-seq data for H3K9me3 occupied regions near the SATB1 promoter. (D–G) HuT78 cells were treated with vehicle or increasing concentrations of the EZH2 inhibitor GSK126 for 48 hours in duplicate for MTT assay (D), SUV39H1 inhibitors chaetocin (E) and F5446 (F), or the HDAC inhibitor romidepsin (G) in duplicate, and MTT assays were performed after 72 hours. Representative of 2 independent experiments. (H–J) ChIP-PCR experiments on HuT78 cells treated with IC50 values of GSK126 (H), chaetocin (I), and romidepsin (J) pulled down with anti-H3K27me3 (clone C36B11), anti-H3K9me3 (Abcam, ab8898), or anti-H3K27ac (Abcam, ab4729), respectively. Representative of 2 independent experiments. (K) RNA was extracted from HuT78 cells identically treated for 48 hours was reversed transcribed, and SATB1 mRNA expression was quantified by q-PCR normalized to human GAPDH mRNA. Data pooled from 4 independent experiments are shown. (L) q-PCR quantification of SATB1 mRNA expression normalized to TATA-binding protein (TBP) mRNA 72 hours after treatment with the indicated doses of chaetocin, F5446, or romidepsin. Pooled from 4 independent experiments. (M) Histogram of annexin V staining on HuT78 cells treated with the IC50 value of chaetocin, F5446, or romidepsin. Two-tailed Student’s t test (B, C, and H–L): *P < 0.05; **P ≤ 0.01; ****P ≤ 0.0001.

