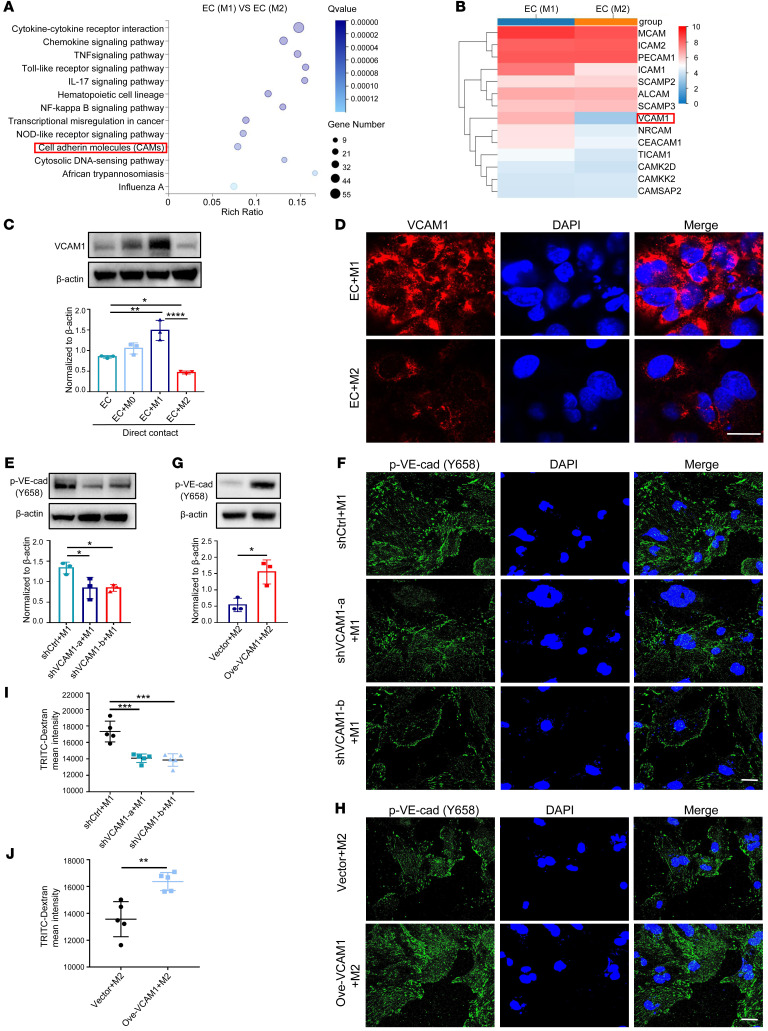
Figure 1. M2 macrophages induce hypopermeability by downregulating VCAM1 in ECs (A) KEGG pathway analysis of DEGs in M1 macrophage–treated HUVECs versus M2 macrophage–treated HUVECs.
(B) Gene expression heatmap of differentially expressed CAM genes from A. (C) Expression of VCAM1 in HUVECs detected by Western blot in different cocultures (n = 3). (D) Localization of VCAM1 protein (red) by immunofluorescence analysis. DAPI stains cell nucleus. Scale bar: 20 μm. (E) p–VE-cad expression in M1 macrophage–cocultured HUVECs that were transiently transfected with VCAM1-specific shRNAs (shVCAM1-a, shVCAM1-b) or a control shRNA (shCtrl) (n = 3). (F) Immunofluorescence analysis of p–VE-cad in M1 macrophage–cocultured HUVECs with VCAM1 knocked down. Scale bar: 20 μm. (G) p–VE-cad expression in M2 macrophage–cocultured HUVECs that were transiently transfected with a VCAM1-specific vector (Ove-VCAM1) or a control vector (n = 3). (H) Immunofluorescence analysis of p–VE-cad in M2 macrophage–cocultured HUVECs with VCAM1 overexpressed. Scale bar: 20 μm. (I) TRITC-Dextran tracer fluorescence from M1 macrophage–cocultured HUVECs that were transfected with VCAM1 knockdown shRNAs (shVCAM1-a, shVCAM1-b) or a control shRNA (shCtrl; n = 5). (J) TRITC-dextran tracer fluorescence from M2 macrophage–cocultured HUVECs that were transfected with VCAM1-specific vector (Ove-VCAM1) or control vector (n = 5). Data represent 3 independent experiments. Results are shown as mean ± SD. *P < 0.05; **P < 0.01; ***P < 0.001; **** P < 0.0001, 1-way ANOVA (C, E, I) and Student’s t test (G and J).

