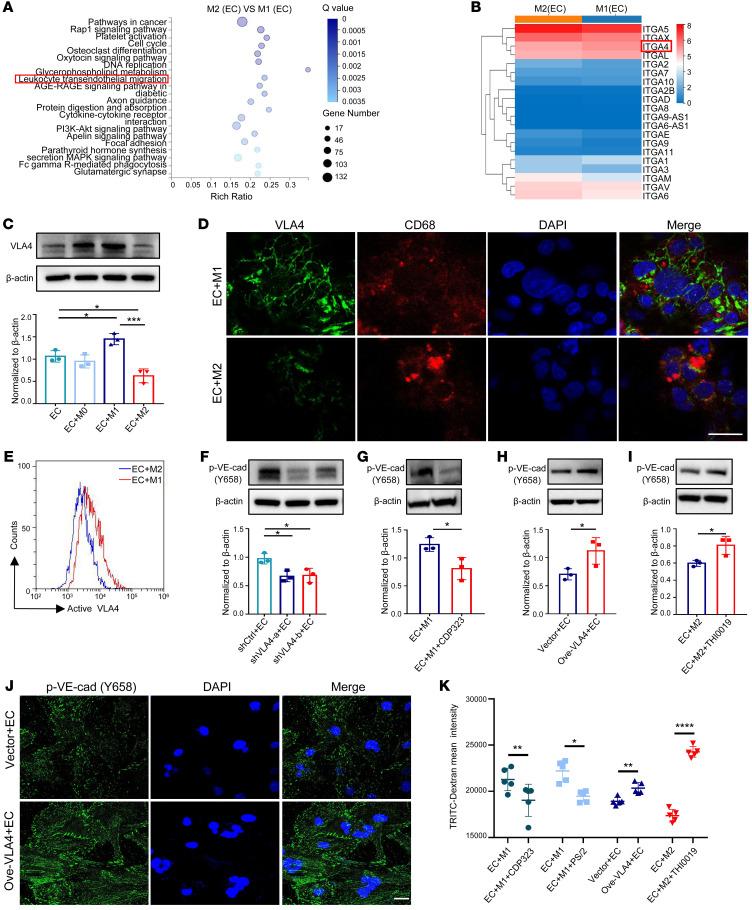
Figure 2. Decreased VLA4 activation in M2 macrophages cocultured with ECs.
(A) KEGG pathway analysis of DEGs when comparing M2 versus M1 macrophages from cocultures. (B) Gene expression heatmap of differentially expressed integrin genes from A. (C) Expression of VLA4 in THP-1 macrophages detected by Western blot in different cocultures (n = 3). (D) Localization of VLA4 protein (green) in THP-1 macrophages by immunofluorescence analysis. CD68 (red) stains macrophages. DAPI stains cell nucleus. Scale bar: 20 μm. (E) Representative graph of flow cytometric analysis of active VLA4 levels in different subtypes of THP-1 macrophages from cocultures. (F) p–VE-cad expression in HUVECs cultured with macrophages that were transiently transfected with VLA4-specific shRNAs (shVLA4-a, shVLA4-b) or a control shRNA (shCtrl) (n = 3). (G) p–VE-cad expression in HUVECs from M1 macrophage–coculture system treated with CDP323 (n = 3). (H) p–VE-cad expression in HUVECs cocultured with macrophages that were transiently transfected with a VLA4-specific vector (Ove-VLA4) or a control vector (n = 3). (I) p–VE-cad expression in HUVECs from M2 macrophage–coculture system treated with THI0019 (n = 3). (J) Immunofluorescence analysis of p–VE-cad expression in HUVECs cultured with macrophages that were transiently transfected with a VLA4-specific vector (Ove-VLA4) or a control vector. Scale bar: 20 μm. (K) TRITC-dextran tracer fluorescence from coculture systems in which macrophages transiently transfected with a VLA4-specific vector (Ove-VLA4) or pretreated with THI0019, PS/2, and CDP323 are compared with the respective control (n = 5). Data represent 3 independent experiments. Results are shown as mean ± SD. *P < 0.05; **P < 0.01; ***P < 0.001; ****P < 0.0001, Student’s t test (G–I and K) and 1-way ANOVA (C and F).

