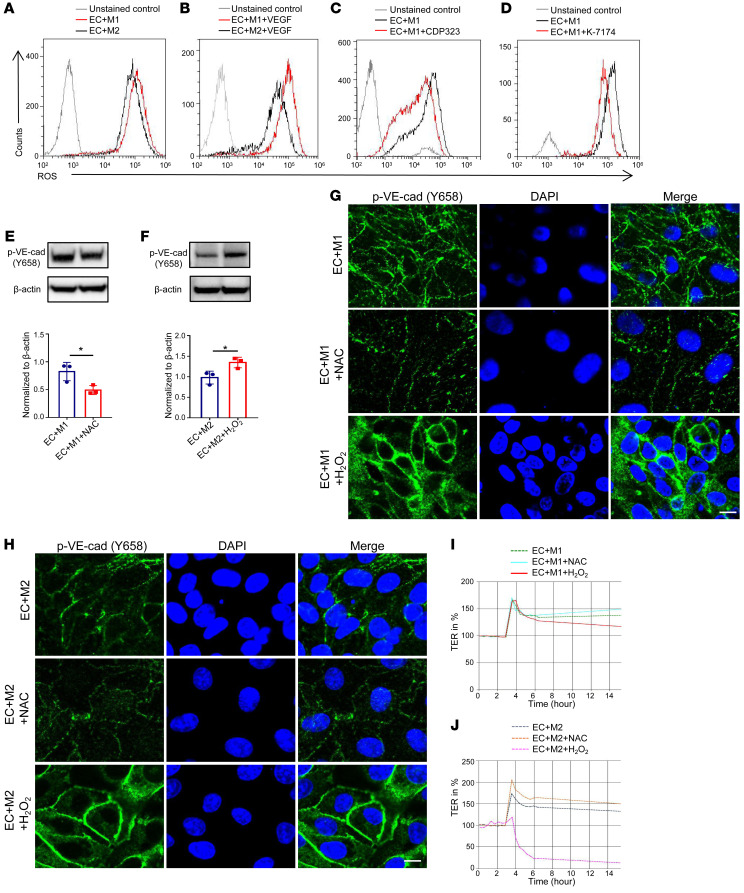
Figure 3. ROS functions downstream of VCAM1 in regulating macrophage-mediated permeability.
(A–D) Representative graphs of flow cytometric analysis of ROS levels in HUVECs cocultured with different subtypes of macrophages (A), treated with VEGF (B), and in HUVECs from M1 macrophage–coculture system treated with CDP323 (C) or K-7174 (D). (E) Immunoblot analysis of p–VE-cad expression in HUVECs from M1 macrophage–cocultured system treated with NAC (n = 3). (F) p–VE-cad expression in HUVECs from M2 macrophage–cocultured system treated with H2O2 (n = 3). (G and H) Immunofluorescence of p–VE-cad expression in HUVECs from M1 (G) or M2 (H) macrophage–cocultured system treated with NAC and H2O2. Scale bars: 20 μm. (I and J) Effects of NAC or H2O2 treatment in HUVECs from M1 macrophage–cocultured system (I) or M2 macrophage–cocultured system (J) measured in real time using the automated system (cellZscope). Data represent 3 independent experiments. Results are shown as mean ± SD. *P < 0.05, Student’s t test (E, F).

