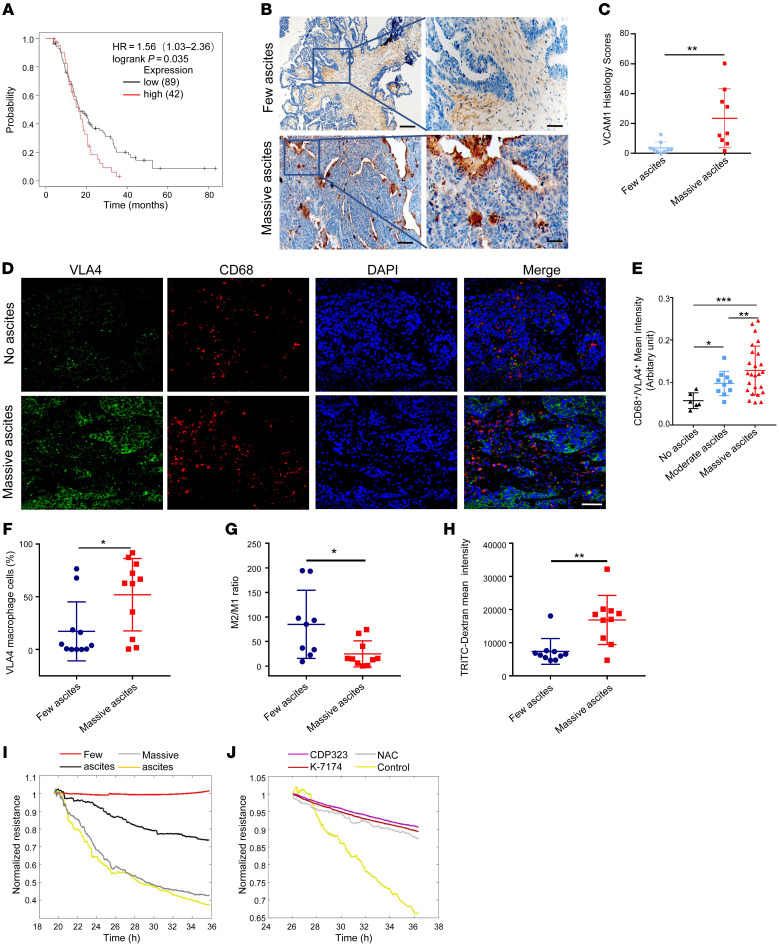
Figure 6. VLA4/VCAM1 expression is correlated with ascites volume.
(A) Kaplan-Meier Plotter analysis showed that high VLA4 expression is correlated with shorter overall survival. (B and C) Analysis of VCAM1 expression in OC tissues from patients with few ascites (less than 500 ml) or massive ascites (more than 1000 mL) based on immunohistochemistry results (n = 9). Scale bars: 200 μm (left); 50 μm (right). (D) Representative immunofluorescence images of VLA4 expression in human OC tumors from patients with few ascites or massive ascites (n = 10). Green, VLA4; red, CD68; blue, nucleus. Scale bar: 50 μm. (E) Correlation between ascites volume and VLA4 expression in macrophages of OC tissue. Few ascites (less than 500 ml); moderate ascites (500 ml–1000ml); massive ascites (more than 1000 mL). (F) Percentage of VLA4-expressing macrophages in different OC ascites (n = 11). (G) Ratio of M2 to M1 macrophages in OC ascites (n = 9 for few ascites group, n = 10 for massive ascites group). (H) Permeability analysis using macrophages isolated from OC patient ascites detected by TRITC-Dextran assay (n = 10). (I) Permeability assay using macrophages isolated from OC patient ascites detected by ECIS equipment. (J) Permeability assay of macrophages isolated from OC patient ascites cocultured with HUVECs with CDP323, K-7174, NAC, or control treatment detected by ECIS. Results represent 3 independent experiments. Results are shown as the mean ± SD. *P < 0.05; **P < 0.01; ***P < 0.001, 1-way ANOVA (E) and Student’s t test (C and F–H).

