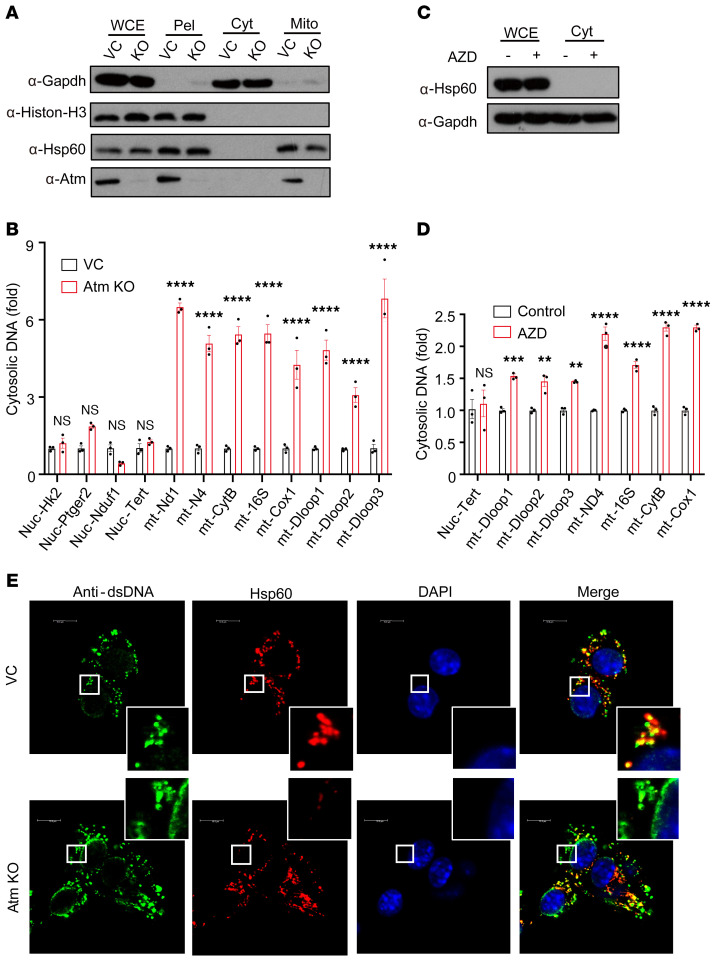
Figure 3. ATM inhibition increases the cytoplasmic release of mtDNA.
(A) WB verification of our cytosol fractionation protocol. Vector control and ATM-KO B16 cells were fractionated, and whole-cell extracts (WCE), pellets (Pel), cytosolic extracts (Cyt), and mitochondrion (Mito) were blotted using the indicated antibodies. (B) qRT-PCR quantification of cytosolic DNA extracted from digitonin-permeabilized cytosolic extracts of control and ATM-KO B16F10 cells. Normalization was carried out as described in Methods. (C) WB analysis of B16F10 cells treated with 1 μM AZD1390 for 48 hours and subjected to fractionation. (D) qRT-PCR analysis of DNA extracted from digitonin-permeabilized extracts of control and AZD1390-treated B16F10 cells. (E) Vector control and Atm-KO B16F10 cells were costained with anti-dsDNA (green), anti-Hsp60 (red), and DAPI. Scale bars: 10 μm. Original magnification, ×12 (insets). Data represent the mean ± SEM (B and D). **P < 0.01, ***P < 0.001, and ****P < 0.0001, by 2-way ANOVA. n = 3 (B and D). Nuc, nuclear.

