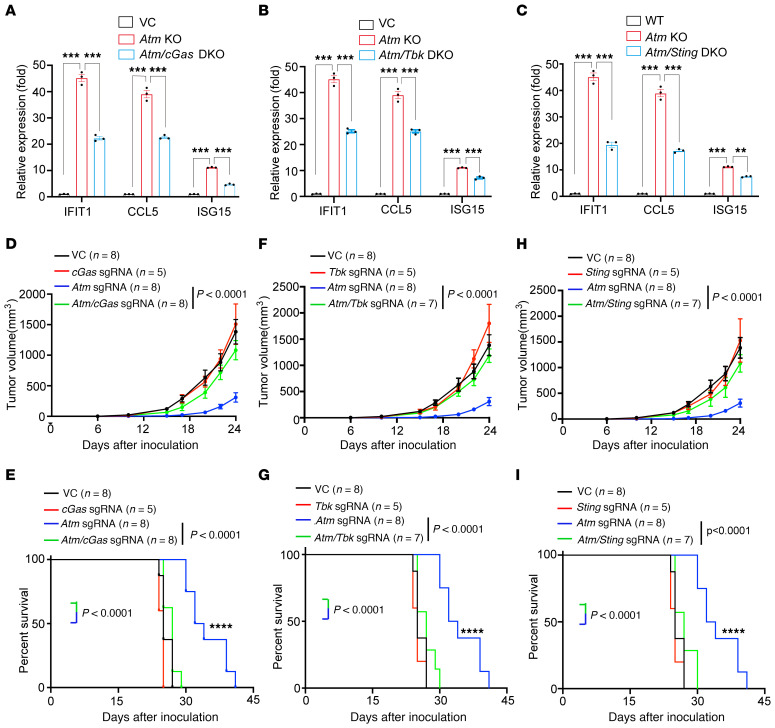
Figure 6. The cGAS/STING pathway is functionally required for a type 1 IFN response and tumor growth suppression mediated by ATM inhibition.
(A–C) Transcriptional levels of the ISGs Ifit1, Ccl5, and Isg15 in B16F10 cells with vector control, Atm KO, or Atm/cGas DKO (A), Atm/Tbk1 DKO (B), or Atm/Sting DKO (C) as analyzed by real-time qRT-PCR. n = 3. (B) Transcriptional levels of ISGs in vector control, Atm-KO, and Atm/Tbk1-DKO B16F10 cells as analyzed by real-time qRT-PCR. (C) Transcriptional levels of ISGs in vector control, Atm-KO, and or Atm/Sting-DKO B16F10 cells as analyzed by real-time qRT-PCR. (D and E) Tumor volume and Kaplan-Meier survival curves for C57BL/6 mice inoculated with 1 × 10⁵ vector control, cGas-KO, Atm-KO, or Atm/cGas-DKO B16F10 cells. (F and G) Tumor volume and Kaplan-Meier survival curves for C57BL/6 mice inoculated with 1 × 10⁵ vector control, Tbk1-KO, Atm-KO, or Atm/Tbk1-DKO B16F10 cells. (H and I) Tumor volume and Kaplan-Meier survival curves for C57BL/6 mice inoculated with 1 × 10⁵ vector control, Sting-KO, Atm-KO, or Atm/Sting-DKO B16F10 cells. The vector control and Atm-KO groups were the same in D–I. Data are presented separately for easier visualization. Data represent the mean ± SEM. **P < 0.01, ***P < 0.001, and ****P < 0.0001, by unpaired t test (A–D, F, and H) or log-rank test (E, G, and I).

