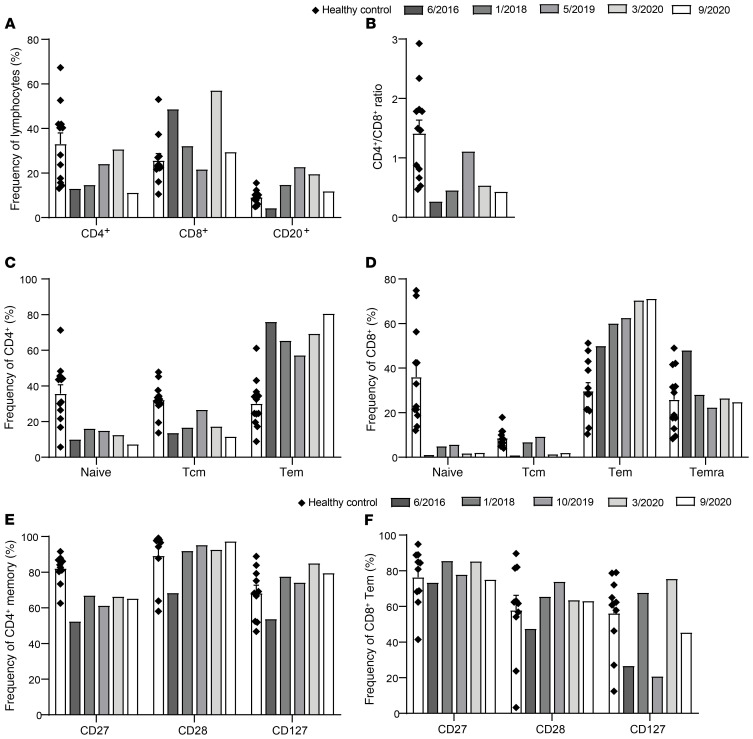
Figure 9. Increases in DOCK8-expressing cells correlate with improvements in phenotype.
PBMCs from healthy donors (n = 10–12) and P1 taken at various time points were stained for surface expression of CD4, CD8, CD20, CCR7, CD45RA, CD10, CD27, CD28, and CD127. Frequencies of (A) CD4+ T cells, CD8+ T cells, and B cells (CD20+); (B) CD4+/CD8+ ratio; (C) naive, Tcm, and Tem CD4+ T cells; (D) naive, Tcm, Tem, and Temra CD8+ T cells; exhaustion marker–expressing (E) CD4+ CD45RA–CCR7+/– memory T cells; and (F) CD8+ CD45RA–CCR7– effector memory T cells were determined by flow cytometry. Error bars represent SEM.

