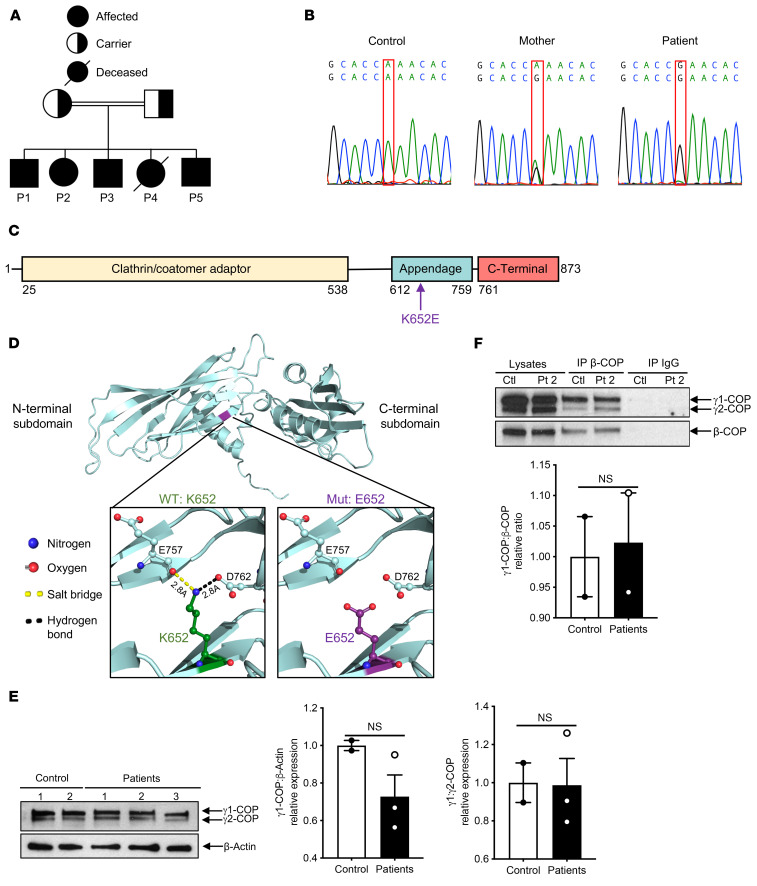
Figure 1. Homozygous COPG1K652E mutation in the patients.
(A) Family pedigree. (B) Sanger sequencing of the region surrounding the mutation in COPG1 (c.A1954G:p.K652E) in control, mother, and P1. (C) Linear map of γ1-COP. Arrow indicates the location of the K652E missense mutation in the appendage domain. (D) Ribbon diagram of the human γ1-COP appendage domain (aa 608–874) and its N-terminal and C-terminal subdomains. Insets show the potential impact of the mutation on the local interactions between the WT K652 (left) or mutant E652 residue (right) and residues E757 in the N-terminal subdomain, and D762 in the C-terminal subdomain. (E) Representative immunoblot of γ-COP (γ1-COP and γ2-COP) in fibroblasts from P1, P2, and P3 (n = 3) and controls (n = 2) (top) and quantitation of γ1-COP/β-actin and γ1-COP/ γ2-COP ratios in patients relative to controls in 2 independent experiments (bottom). (F) Representative γ-COP (γ1-COP and γ2-COP) and β-COP immunoblot of lysates and of β-COP and IgG control immunoprecipitates, from P2 and control fibroblasts (top) and quantitation of γ1-COP/β-COP ratio in patients relative to controls (n = 2 each) in 3 independent experiments (bottom). Columns and bars represent mean ± SEM.

