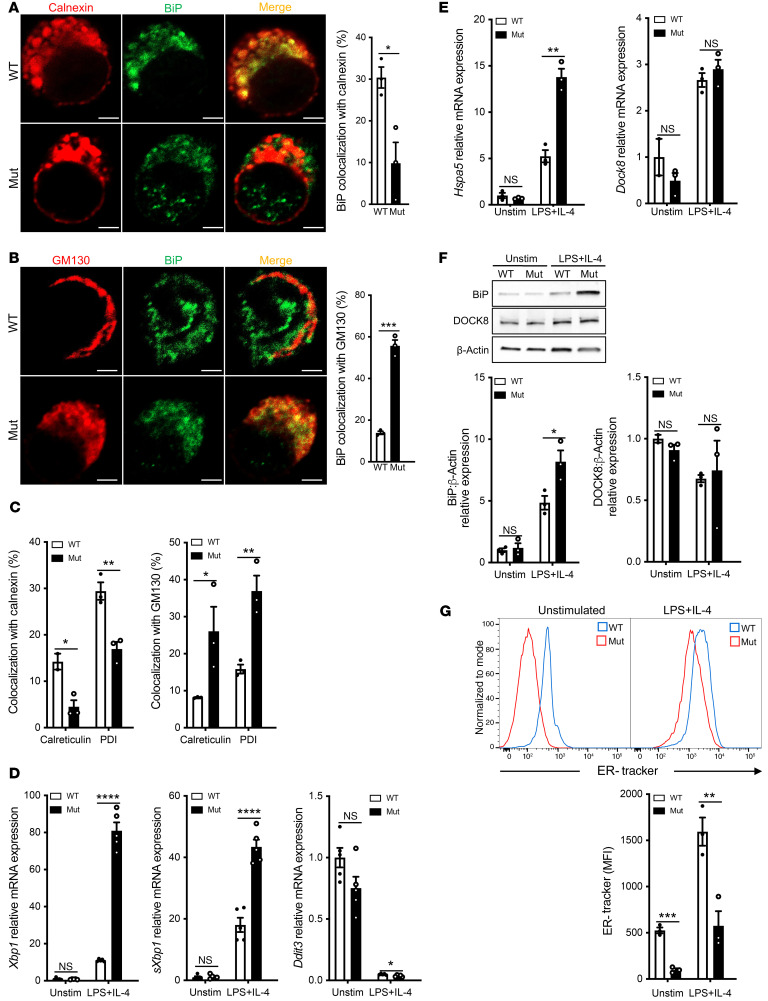
Figure 3. Activated B cells from homozygous Copg1K652E mutant mice have mislocalized BiP and increased ER stress.
(A) Representative images of LPS+IL-4 stimulated B cells from mutant mice and controls stained for the ER marker calnexin (red) and BiP (green) and merged (yellow) (left). Scale bars: 2 μM. Quantitation of colocalization of calnexin and BiP (right) with a representative result from 3 independent experiments shown. n = 3 cells examined in each. (B) Representative images of B cells from the same experiment in A, stained for the Golgi marker GM130 (red) and BiP (green) and merged (yellow) (left). Scale bars: 2 μM. Quantitation of colocalization of GM130 and BiP (right) with a representative result from 3 independent experiments shown. n = 3 cells examined in each. (C) Quantitation of colocalization of calreticulin and PDI with calnexin and with GM130 in LPS+IL-4 stimulated B cells from mutant mice and WT controls. (D) Relative mRNA expression of the UPR response genes Xbp1, sXbp1, and Ddit3 in unstimulated and LPS+IL-4 stimulated B cells from mutant mice and WT controls. n = 3 independent experiments each with 5 mice per group. (E) Relative Hspa5 and Dock8 mRNA expression. n = 3 independent experiments each with 3 mice per group. (F) Representative immunoblot of BiP and DOCK8 in unstimulated and LPS+IL-4 stimulated B cells from mutant mice and WT controls and quantitative analysis of the results of BiP or DOCK8 expression relative to WT control from 3 experiments with 3 mice per group. (G) Representative histogram analysis of ER-Tracker dye uptake by unstimulated and LPS+IL-4 stimulated mutant and WT B cells (left) and quantitation of MFI of ER-Tracker dye in 4 experiments each with 3 mice/group (right). Columns and bars represent mean ± SEM. *P ≤ 0.05; **P ≤ 0.01; ***P ≤ 0.001; ****P ≤ 0.0001, 2-tailed Student’s t test.

