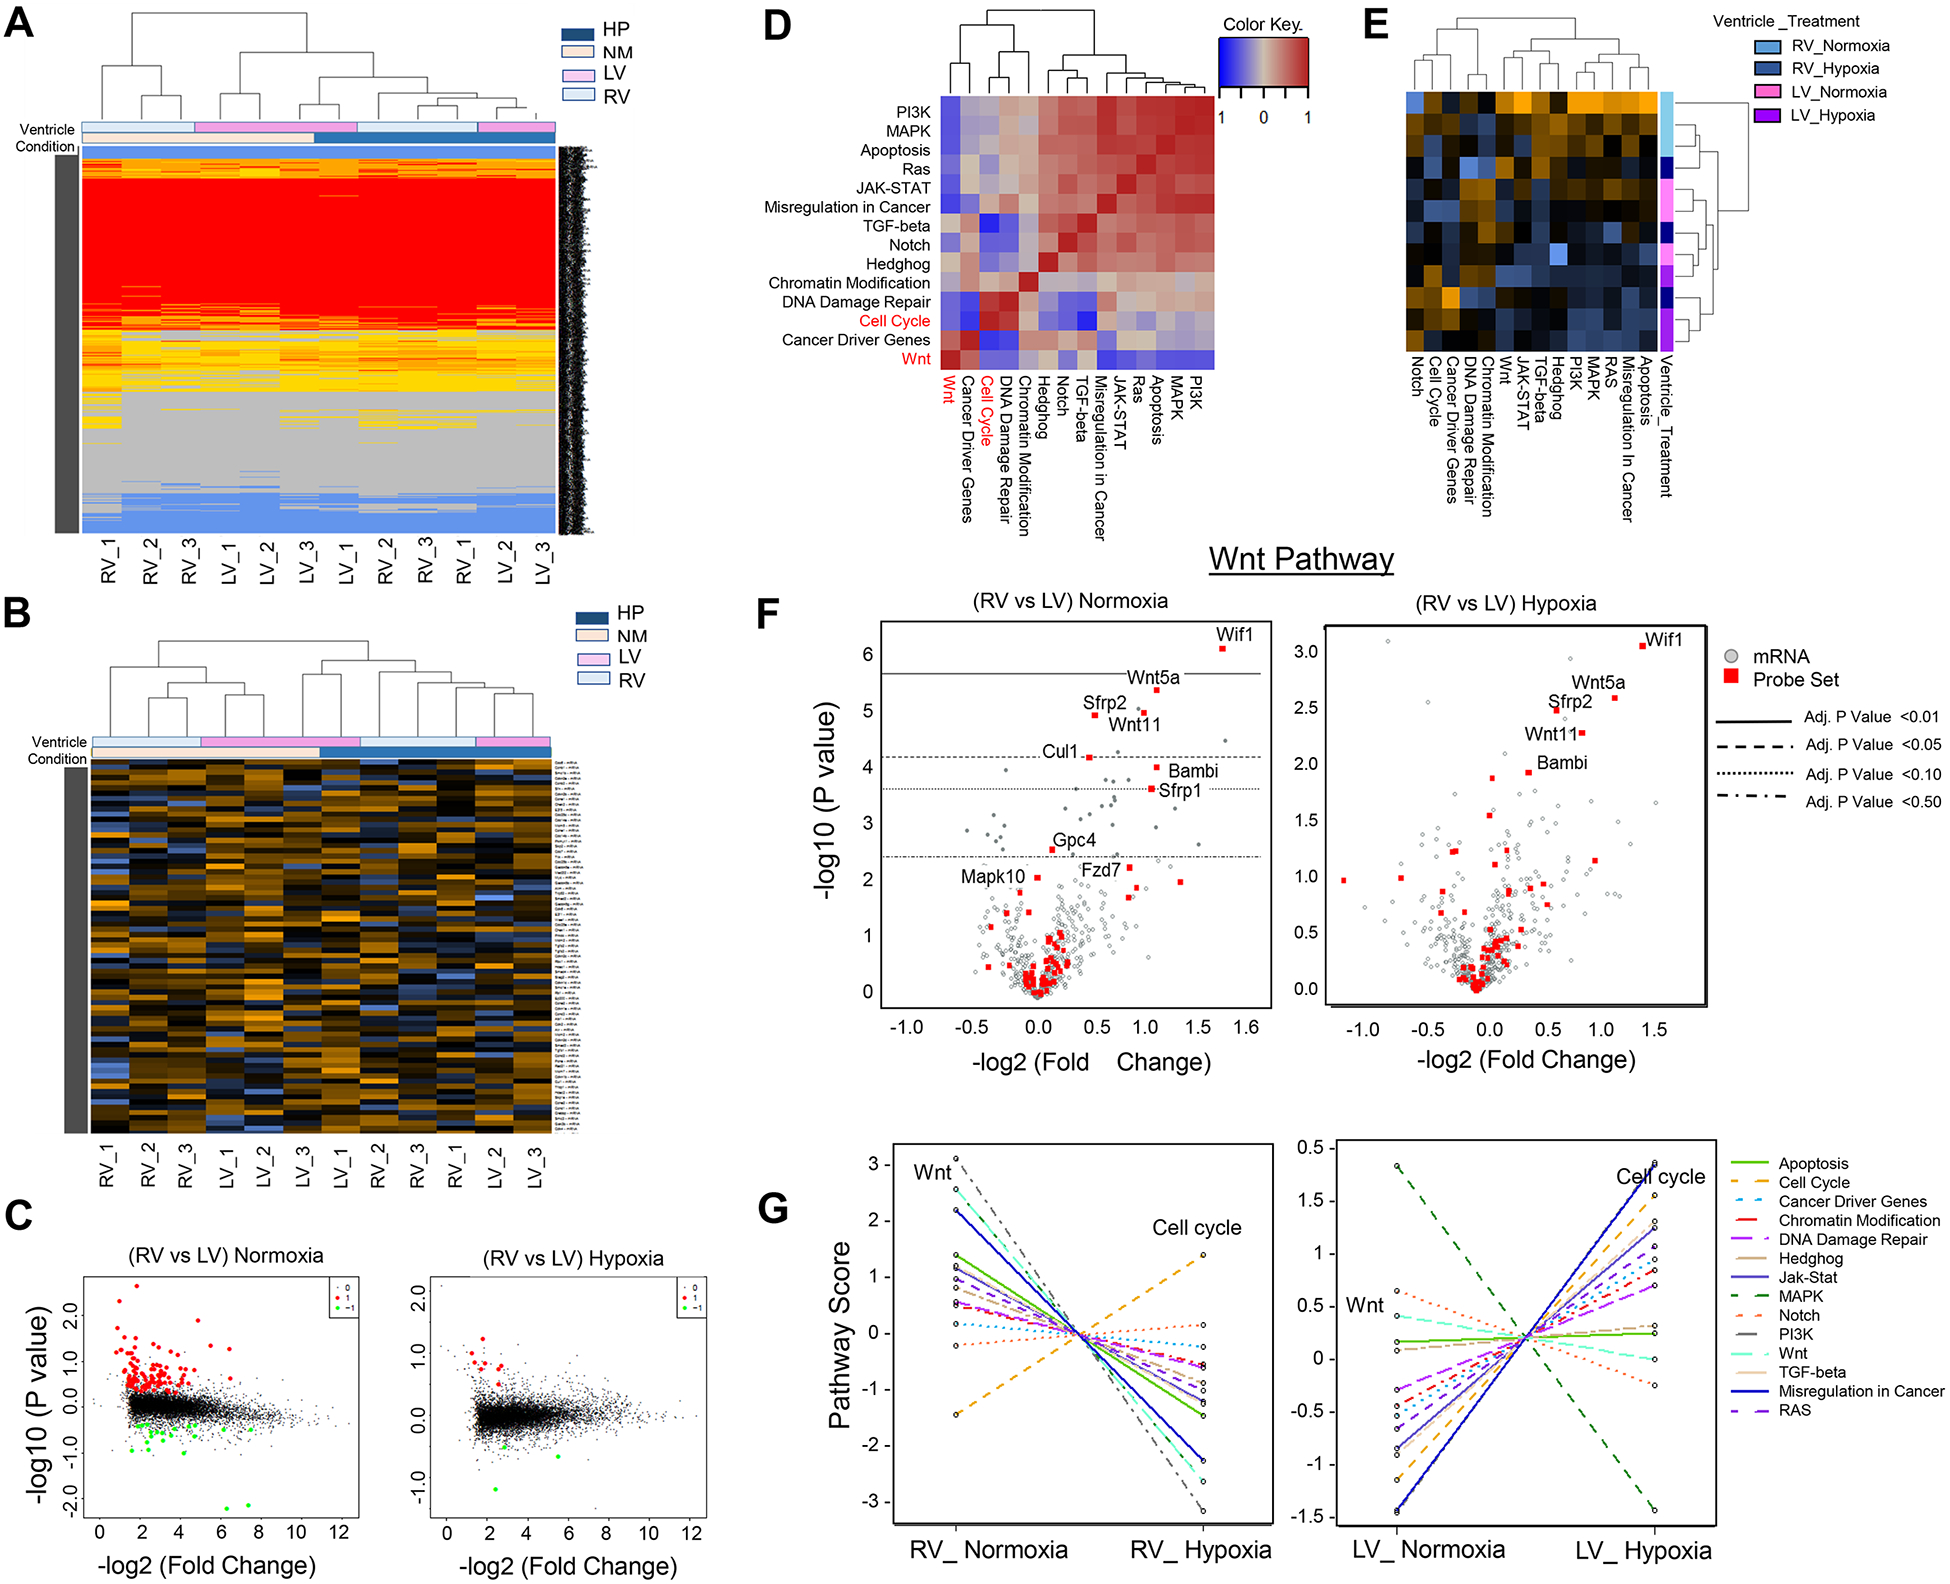
Figure 2. Hypoxia-Induced Attenuation of Ventricular Patterning in Neonatal Mouse Heart.

A. Unsupervised Hierarchical clustering of all transcripts from RV and LV of normoxia-treated and hypoxia-treated neonatal mouse hearts. B. Expression heat map of significant differentially expressed genes (DEGs). C. Volcano Plots display pair-wise comparison analysis (RV vs LV) in normoxia and hypoxia conditions. D. Pathway correlation plot of normoxia-treated RV (X Axis) compared to hypoxia-treated RV (Y Axis) depicts significant inverse correlation between cell cycle processes and Wnt signaling. E. Heat map depicts pathway enrichment signature in RV compared to LV in normoxia and hypoxia conditions. The chamber-specific signature is lost in hypoxia-treated hearts more significantly in RV. Blue: negative score. Orange: positive score. F. Volcano blots of Wnt signaling genes display reduced DGE in RV vs LV in neonatal mouse heart in hypoxia-treated neonatal mouse hearts compared to normoxia condition. G. Pathway enrichment analysis demonstrates trend changes of pathway scores (Bonferroni-adjusted P value) in RV (normoxia vs hypoxia) and in LV (normoxia vs hypoxia).
