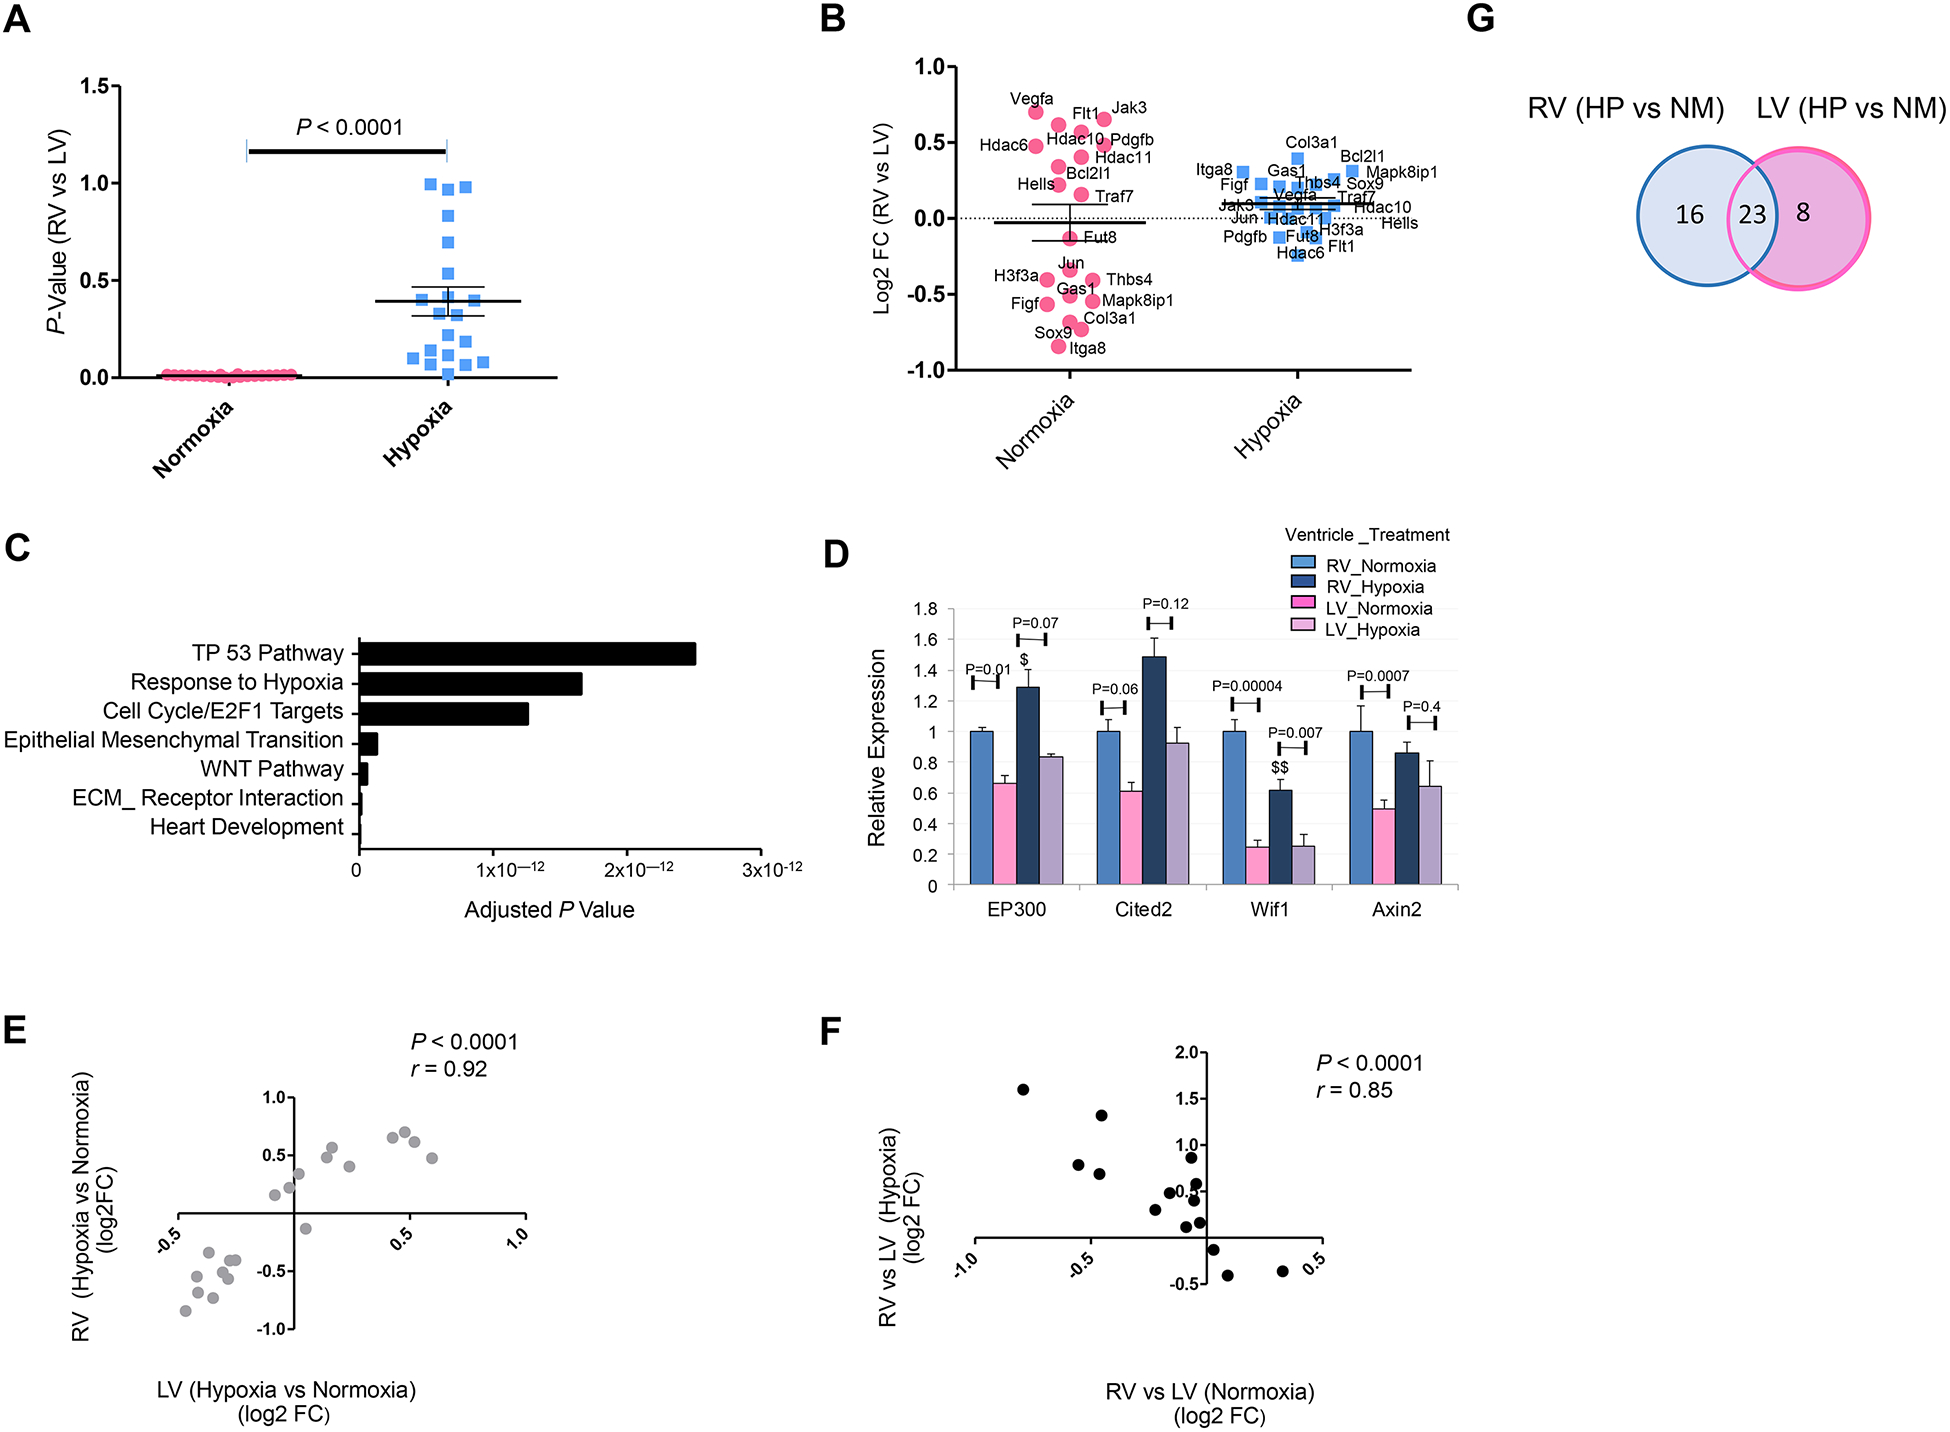
Figure 4. Hypoxemia-Induced Attenuation of Ventricular Patterning (AVP).

A and B. P value distribution (A) and magnitude of expression differences [Log2 Fold Change (FC)] (B) of top 20 differentially expressed genes (RV vs LV) that exhibited attenuation of ventricular patterning (AVP) in P3 neonatal mouse heart in response to systemic hypoxia (hypoxemia) treatment compared to normoxia condition (FDR P Value ≤ 0.05). C. Top GO terms enriched in hypoxia-induced AVP genes in neonatal mouse (Bonferroni-adjusted p value). D. Quantitative expression analysis (qRT-PCR) of hypoxia homeostasis genes (EP300 and Cited2) and Wnt related genes (Wif1 and Axin2) in LV and RV of WT P3 mouse demonstrates significant attenuation of ventricular patterning (fold change and P Values) in hypoxia-treated hearts compared to normoxia condition. $P ≤ 0.05, $$P ≤ 0.01 (hypoxia-treated RV compared to RV normoxia); two-tailed Student’s t test; n=4 per group per condition. E. Correlation analysis of top twenty AVP genes reveals significant concordance in mouse RV and LV. F. Correlation analysis of top genes with inversed attenuation of ventricular patterning (IVP) in hypoxia compared to baseline normoxia. G. Venn diagram depicting the distribution of DEGs in RV vs LV in hypoxia (HP) vs Normoxia (NM) conditions.
