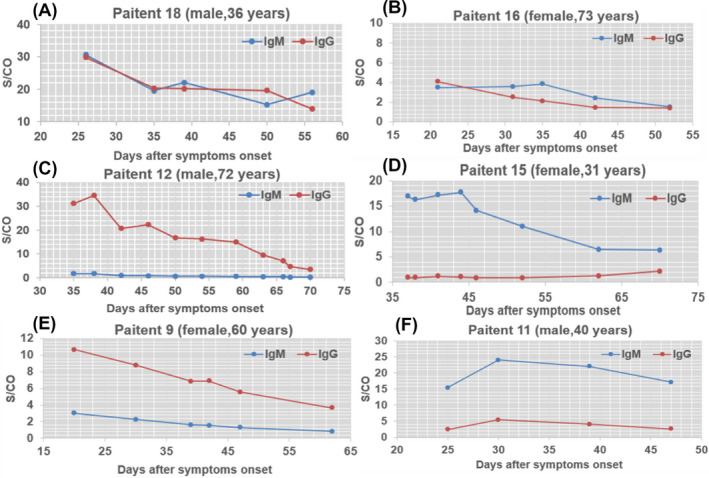
Figure 4.

Dynamic profile of IgM and IgG antibodies in representative COVID‐19 patients after symptoms onset. The changes of the levels of antibodies in serum of six patients was presented, the x‐axis represents the days of ill onset, the y‐axis shows the response value of IgM and IgG antibodies in patient serum detected by Axceed. IgG is depicted in blue, and IgM is depicted in orange
