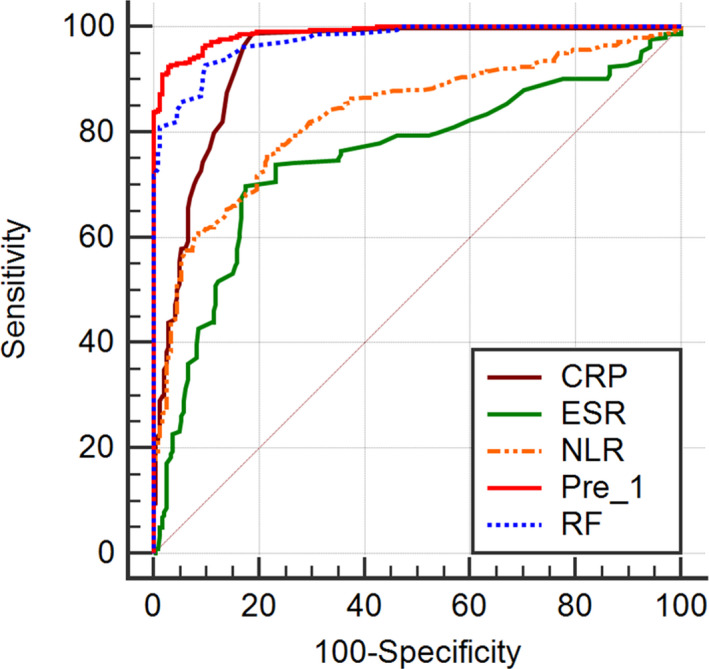
Figure 1.

Receiver operating characteristic curve of CRP, RF, ESR, NLR, and pre‐1 diagnosis of RA. CRP, C‐reactive protein; ESR, erythrocyte sedimentation rate; NLR, neutrophil‐to lymphocyte ratio; Pre‐1, predicted probability‐1; RF, rheumatoid factor. The ROC curve of the diagnostic value of the NLR for RA. At the cutoff value of 2.13 and an AUC of 0.831, the diagnostic sensitivity, specificity, and accuracy were 76.7%, 75.9%, and 76.4%, respectively, which were lower than the corresponding values for RF and CRP but higher than those for ESR
