FIGURE 2.

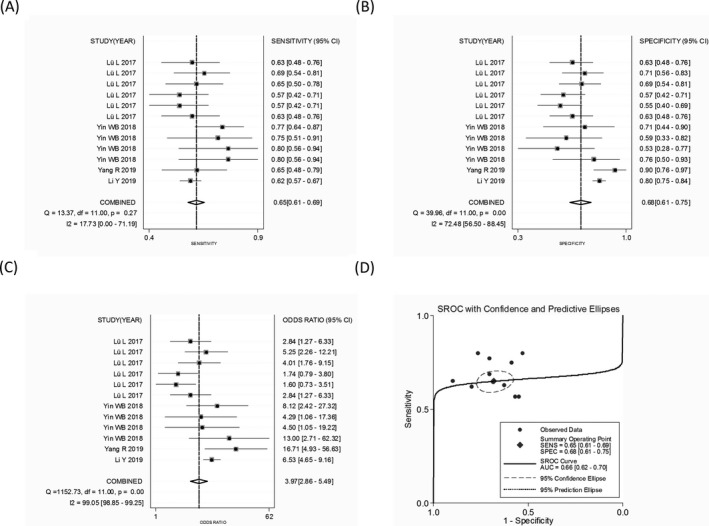
The combined (A) sensitivity, (B) specificity, (C) diagnostic odds ratio, and (D) area under the curve of abnormally expressed circular RNAs in the diagnosis of breast cancer

The combined (A) sensitivity, (B) specificity, (C) diagnostic odds ratio, and (D) area under the curve of abnormally expressed circular RNAs in the diagnosis of breast cancer