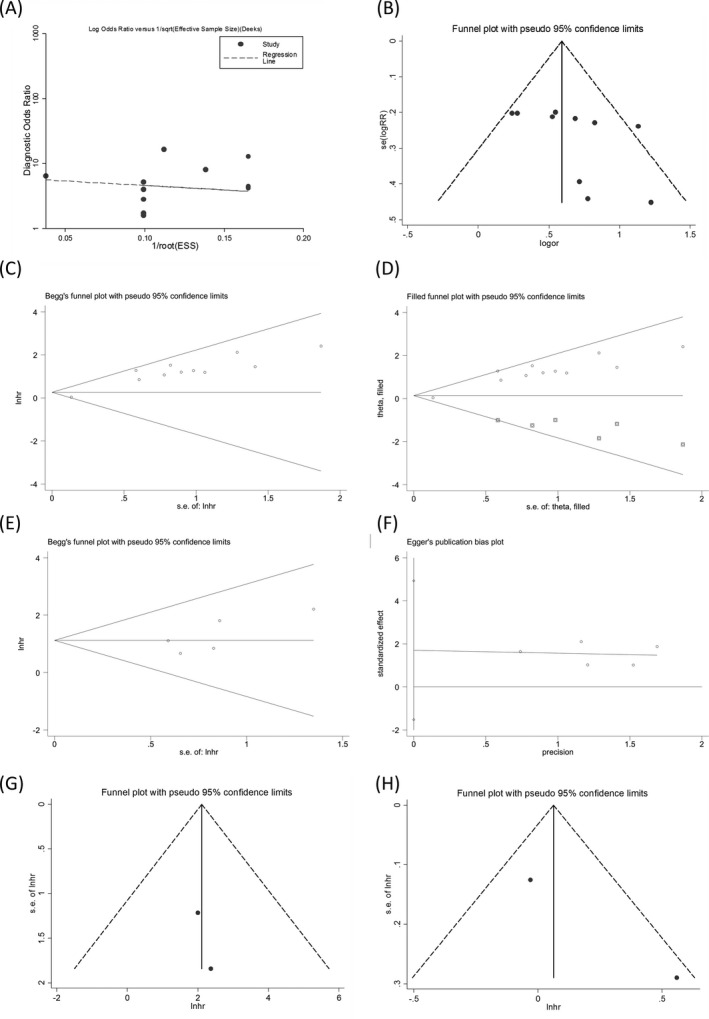
FIGURE 6.

Publication bias in the diagnostic meta‐analysis evaluated by (A) Deek's funnel plot (P = .32) and (B) visual Funnel plot. The prognostic meta‐analyses of the univariate analysis assessed by (C) Begg's test, and (D) nonparametric trim and fill method, and the multivariate analysis by (E) Begg's and (F) Egger's tests. The judgment of publication bias in combined (G) disease‐free survival and (H) progression‐free survival using visual Funnel plot
