FIGURE 1.

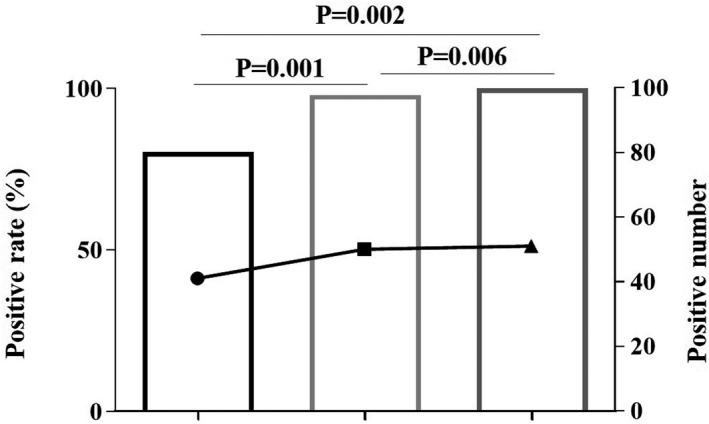
Positive rate of antibody to SARS‐CoV‐2 for the subgroup of 15–21 days after experiencing symptoms. The line graph represents positive number; the bar graph represents positive rate

Positive rate of antibody to SARS‐CoV‐2 for the subgroup of 15–21 days after experiencing symptoms. The line graph represents positive number; the bar graph represents positive rate