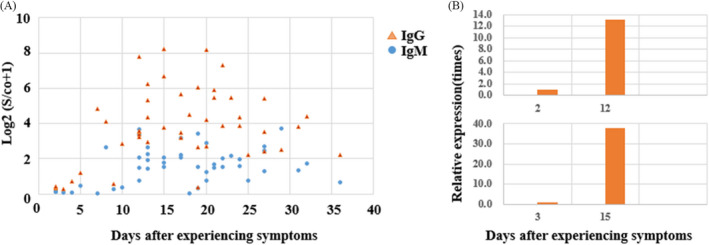
FIGURE 3.

The changes of IgM and IgG to SARS‐CoV‐2 in serum during the course of 16 COVID‐19 patients. (A) The titers of IgM and IgG with the days after experiencing symptoms. (B) The titers comparison of IgG during the course of 16 COVID‐19 patients (only two patients depicted in Figure 3Band seeingAppendix S2for details)
