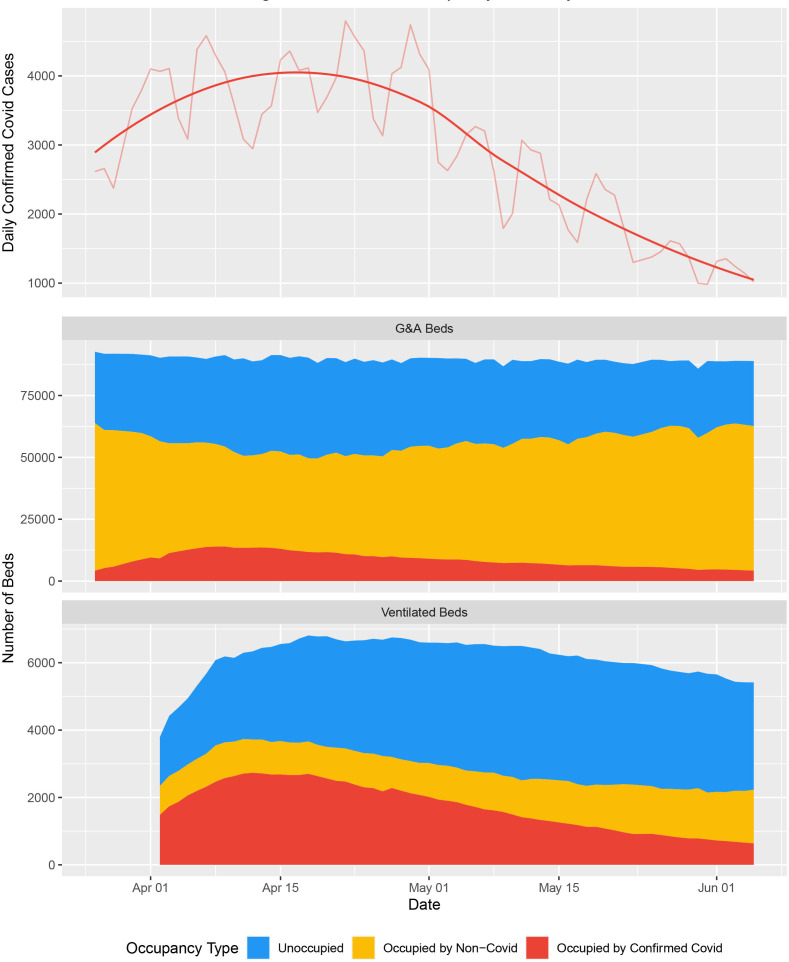
Figure 1.
National and regional bed occupancy. (Top) An epidemic curve showing the number of confirmed cases of COVID-19 across England based on the date that the specimen was taken; raw data are available at https://coronavirus.data.gov.uk/details/cases?areaType=nation&areaName=England. The superimposed highly saturated solid line represents a smoothened function of the raw data, whereas the less saturated solid line represents the underlying raw values. The former is based on the ggplot loess fit for trend lines, using local polyregression curve fitting. (Middle) Total capacity and occupancy status for general and acute (G&A) beds at the national level over the course of the first wave. (Bottom) Total capacity and occupancy status for beds compatible with mechanical ventilation at the national level.

