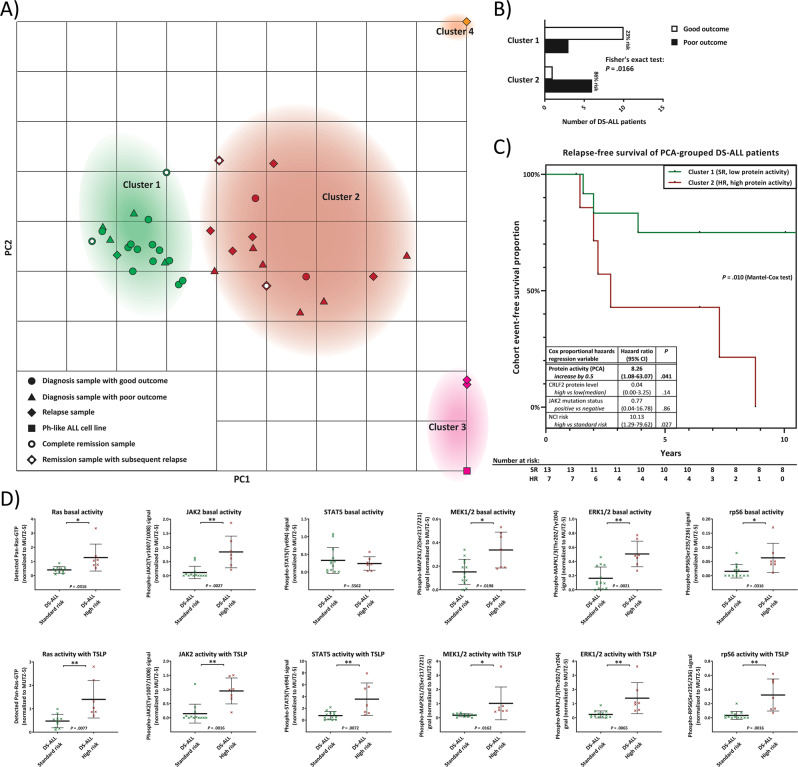
Fig. 5. Sub-stratification of DS-ALL patients based on primary cells: RAS-activation and downstream signaling in relation to standard-therapy outcomes.
a A PCA was performed on the quantified data of Fig. 4 (data was given as continuous variables; no cutoffs nor pre-groupings were used) for the DS-ALL cohort at diagnosis, and (where available) at remission, and relapse, as well as presentation and relapse samples from Non-DS ALL patients. Top view of the PCA-mapping for all six analyzed protein-activities (basal and TSLP-induced) as well as CRLF2-protein expression of all samples along the calculated principal components (see also Supplementary Fig. S6A). K-means unsupervised clustering (with k set to 4 to achieve minimal class-class deviation, Supplementary Fig. S6B) grouped samples into clusters 1–4 (listed in Supplementary Fig. S6C). b PCA Clusters 1 and 2 contain all samples of the DS-ALL diagnosis cohort and were analyzed according to their outcome: A Fisher’s exact test determined the P value between the number of good and poor outcomes between the two clusters (bar graph). c Kaplan–Meier curves of cluster 1 (SR standard risk) and cluster 2 (HR high risk) DS-ALL patients. Table shows a Cox proportional-hazards model for protein activity score (PCA-derived principal component from all quantified protein activities at basal and TSLP-induced level) together with CRLF2-protein expression level (for CRLF2+ samples), NCI risk groups (SR: age at diagnosis 1–10 years and WBC < 50.000/µL; HR = children age >10 years and/or WBC > 50.000/µL; or unknown), and presence of activating JAK2-mutations. Reverse Kaplan–Meier median follow-up for N = 20 DS-ALL was 18.4 years. Patient numbers at risk for each year are given in the table. d The means of all analyzed basal or TSLP-induced protein activities are compared between the SR group (DS-ALL patients in PCA cluster 1) and the HR group (DS-ALL patients in PCA cluster 2). All error bars are SD; P values were calculated using Student’s T test and are adjusted with a Bonferroni-correction for sequential multiple comparison.

