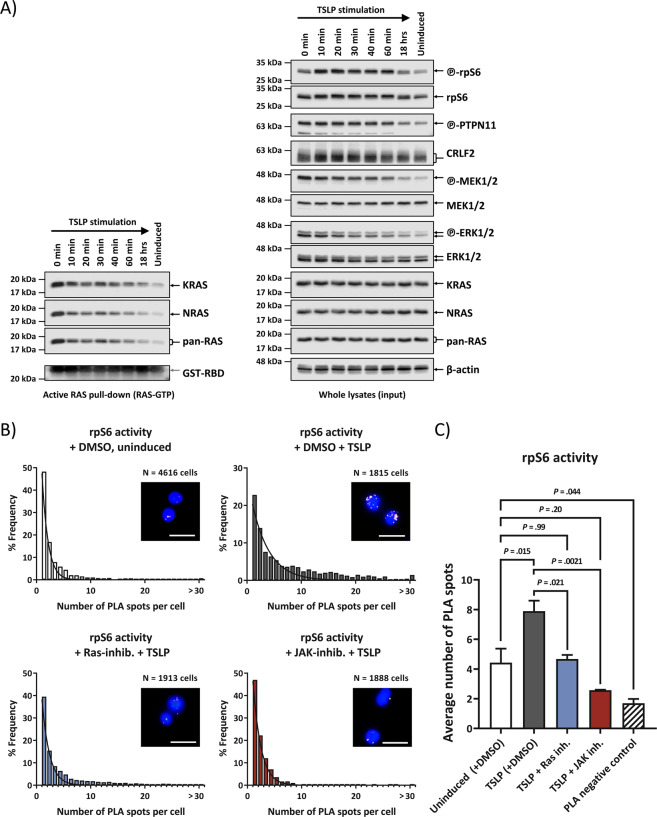
Fig. 6. Direct wtRAS-activation can precede PI3K/mTOR-pathway activation and resulting PI3K-downstream signaling activity was blocked by RAS inhibitor.
a Effect of TSLP induction over time. MUTZ-5 cells were incubated with 20 ng/mL human TSLP at 37 °C for the indicated time points (0 min to 18 h) before cell lysis. Due to the centrifugation step the TSLP can act for 5 min before lysis at timepoint 0. Each cell lysate was split up for RAS-GTP pull-down assay and WB. RAS-GTP pull-down elutions are on the left side while the right-hand side blots show whole cell lysates of the same samples. Antibody-targets are labeled on the right side of each image with black arrows indicating the respective protein band. b Activation of PI3K/mTOR downstream target rpS6 protein was monitored via PLA in high-throughput microscopy. MUTZ-5 cells were either not induced or induced with 20 ng/mL TSLP for 10 min. Where indicated, cells were pre-treated for 3 h with either DMSO (vehicle control), RAS inhibitor, or JAK inhibitor. Cells were fixed and permeabilized in a 96 well plate. After blocking, antibodies against phosphorylated rpS6 and total rpS6 were used in conjunction with PLA rabbit and mouse probes to allow specific readout of rpS6 activation in single cells in a high-throughput manner. Histograms show the distribution for a single experiment of the number of PLA spots in cells with at least 1 PLA spot (assay control is only shown in the bar graph). A minimum of 600 cells were analyzed per sample. Non-linear Gaussian fitting curves were plotted. Fluorescent microscope images show examples of PLA spots in MUTZ-5 cells for the respective treatment; white scale bars are 20 µm long. c The bar graph summarizes the average PLA spot counts of three independent experiments. Error bars are SD and P values were determined in one-way ANOVA and post-hoc Bonferroni multiple comparison.

