
Figure 1.
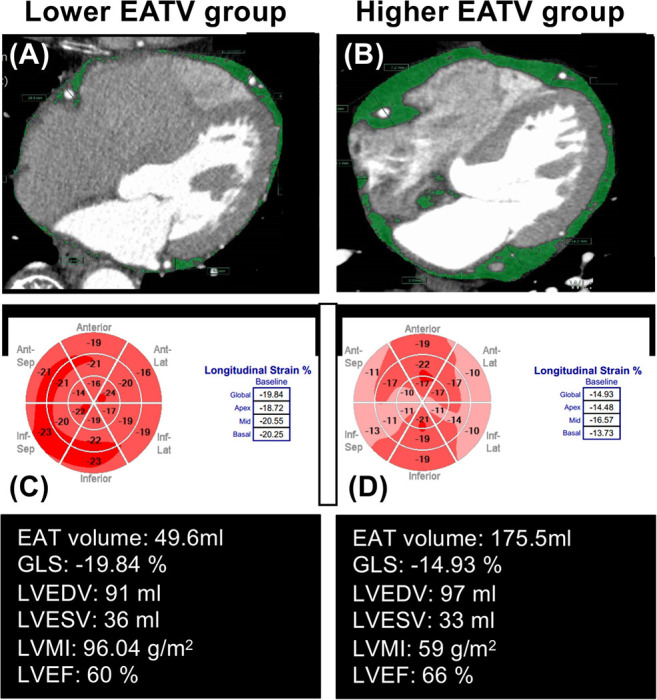
Representative measurements of global longitudinal strain (GLS), in patients with lower and higher epicardial adipose tissue volume (EATV). EAT measurements was manually placed (A,B) along the visceral pericardium; (C,D) the EAT area was automatically acquired as a density range between −190 and −30 HU in cardiac computed tomography. Compared with the lower EATV group (A), with the group with higher EATV (B) had an impaired GLS (−19.84 vs. −14.93%), despite other clinical parameters being similar.