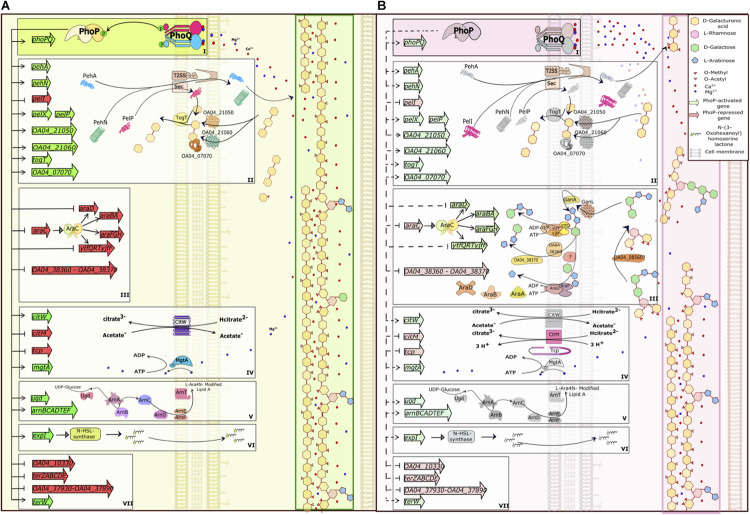
FIGURE 10.
PhoPQ-dependent switch of virulence gene expression in Pve. (A) PhoQ kinase phosphorylates PhoP at low concentrations of calcium and magnesium ions (early infection) leading to maximal activation and repression of its targets. (B) As the infection progresses, extensive plant cell wall degradation releases vast amounts of Ca2+ and Mg2+ leading to inhibition of PhoQ kinase activity and PhoP dephosphorylation. This prevents PhoP-dependent activation, but still allows repression of target genes that have high-affinity PhoP operators. The drawing tries to link the expression of PhoPQ-controlled genes to plant cell wall degradation but does not take into the account other regulators that might influence the same genes. The picture shows the majority of PhoP-repressed genes and a selection of PhoP-activated genes from the same functional categories. The categories are framed and labelled I (the PhoPQ TCS), II (polygalacturonic acid degradation and utilisation), III (arabinogalactan degradation and utilisation), IV (transporters), V (LPS modification), VI (quorum sensing) and VII (tellurite resistance). In the categories II and III, the T2SS and Sec systems, two galactanases and the GanL porin not controlled by PhoP are added for clarity; these proteins are induced in planta and complete the full pathway of degradation, transport and utilisation of pectin components. To simplify the picture, categories IV and V are shown only partially; arabinogalactan degradation products are simplified (fewer sugar residues are drawn). Activation/repression are shown as pointed/blunt arrows. Activated/repressed genes are shaded green/red. PhoP-activated gene products are greyed on (B) to mark their presence in reduced amounts.

