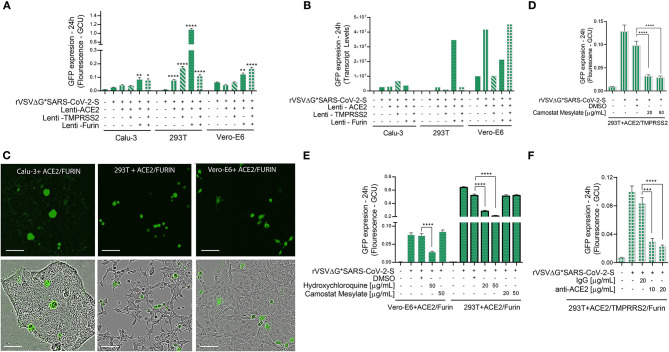
Figure 4.
Viral entry assay in 3 cell lines over-expressing ACE2, TMPRSS2 and/or Furin. Calu-3, 293T cells, and Vero-E6 cells—all over-expressing ACE2, Tmprss2, and/or Furin were inoculated with VSV-ΔG*SARS-CoV-2 spike particles. After 24 h, the GFP signal from 25 images per well was quantified from IncuCyte scan, and normalized to cellular area (A), and then by qPCR from a single well (B). Shown are representative cellular images from IncuCyte scan (C). Infection was quantified from 25 images per well after treatment with anti- ACE2, Hydroxychloroquine or Camostat Mesylate, 20 min before inoculation in 293T and Vero-E6 cells with ACE2, TMPRSS2 and/or Furin over-expression (D–F). Infection was also quantified after treatment with anti-ACE2 antibody or IgG control in 293T cells with ACE2, TMPRSS2, and Furin over-expression. (E). Values are presented as Green Calibrated Units (GCU) normalized to cell area, or mRNA transcripts normalized to GAPDH, respectively. Scale bar: 100 μm. Data are mean±SEM. *p < 0.05; **p < 0.01; ***p < 0.001; ****p < 0.0001 - using One-Way ANOVA with Tukey's post-hoc test. Each experiment was replicated at least three times.

