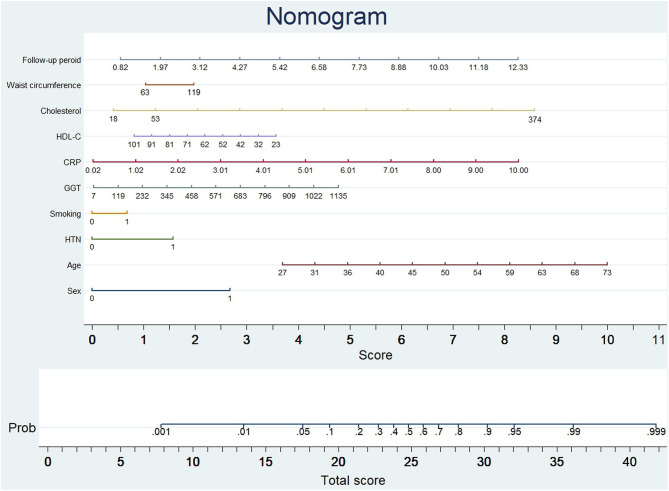
Figure 2.
Nomogram to predict CAC progression in subjects with baseline zero score. (Figure was created by Stata 13, nomolog). To use the nomogram, an individual participant's value is located on each variable axis, and a line is drawn upward to determine the number of points received for each variable value. The sum of these numbers is located on the total points axis to determine the possibility of CAC progression.

