Figure 4.

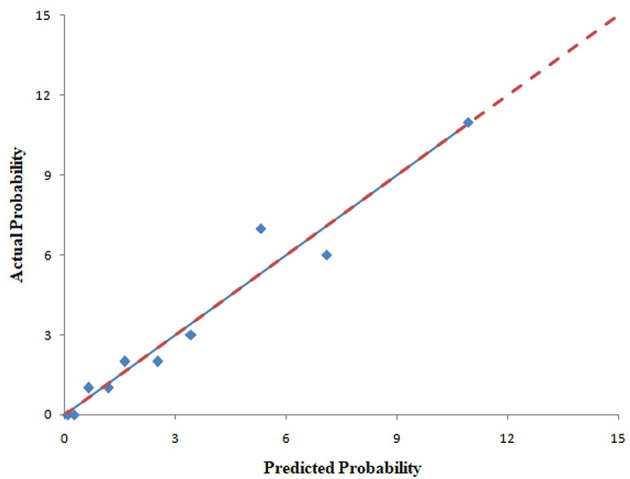
Calibration curves of the nomogram for predicting CAC progression from the validation cohort. The Hosmer–Lemeshow test had a p-value of 0.979 in the validation cohort.

Calibration curves of the nomogram for predicting CAC progression from the validation cohort. The Hosmer–Lemeshow test had a p-value of 0.979 in the validation cohort.