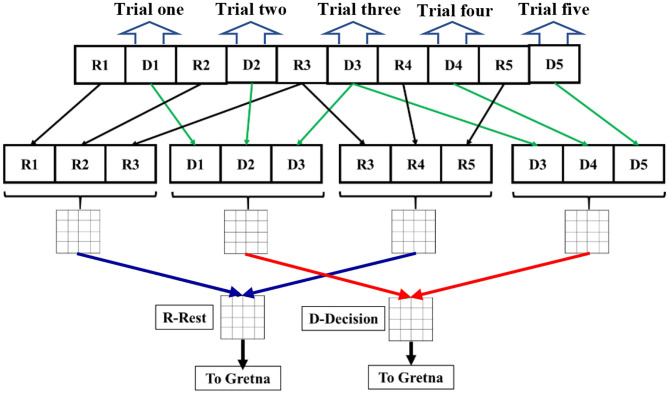
Figure 2.
A schematic flow chart for dynamic graph theory analysis from the 1st trial to 5th trial. Ri denotes the rest period during the ith trial. Di denotes the decision period during the ith period. Rest (black lines) and decision periods (green lines) of three trials were extracted and concatenated into two time series separately in a three-trial moving window overlapping one trial (see that R3 and D3 are used twice for three-trial windows). Each concatenated time series were used to calculate PCC for the dynamic connectivity at each respective time. Then, correlation matrices from multiple three-trial windows were averaged for both rest (blue lines) and decision (red lines) periods, respectively. The final averaged correlation matrices (labeled as R-Rest and D-Decision) underwent Fischer r-to-z transform to calculate network parameters in GRETNA or Gretna for each subject.

