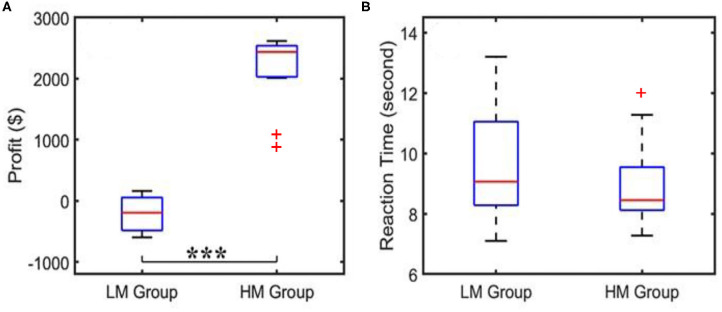
Figure 3.
Behavioral scores showing (A) an average of profit per trial and (B) an average reaction or decision-making time acquired from the LM and HM groups. “***”indicates the statistical significance between the two groups at p < 0.001 (p = 1.9 × 10⁻¹³). The reaction time did not show a significant difference. Outliers are marked by “+”.

