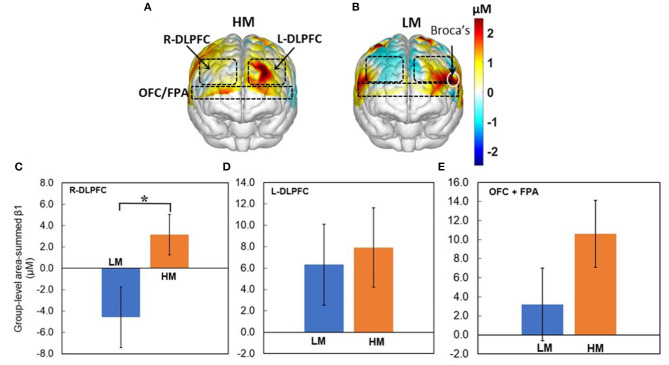
Figure 5.
Topographic β1 maps of Δ[HbO] in response to the 40-trial NP from groups with (A) HM (n = 13) and (B) LM (n = 14) treatment. Group-averaged, area-summed β1 values from groups with HM and LM decision-making tasks in (C) the R-DLPFC (p < 0.015), (D) the L-DLPFC, and (E) the OFC+FPA, respectively. “*” denotes p < 0.05 (corrected). Error bars: standard error of the mean.

