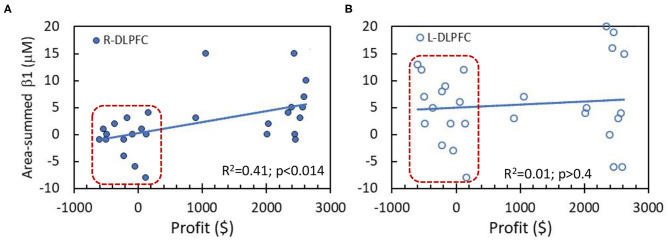
Figure 6.
Correlations between behavior performance (i.e., profit values) and area-summed β1 values of Δ[HbO] from the entire region of (A) R-DLPFC and (B) L-DLPFC. The data within the red boxes were derived from the LM group (n = 14). The solid lines are a linear fit across all the subjects (n = 27 without separating HM and LM tasks) with R2 value of 0.41 and 0.01, respectively, for both DLPFC areas. A significant linear correlation exists only for R-DLPFC at p < 0.014.

