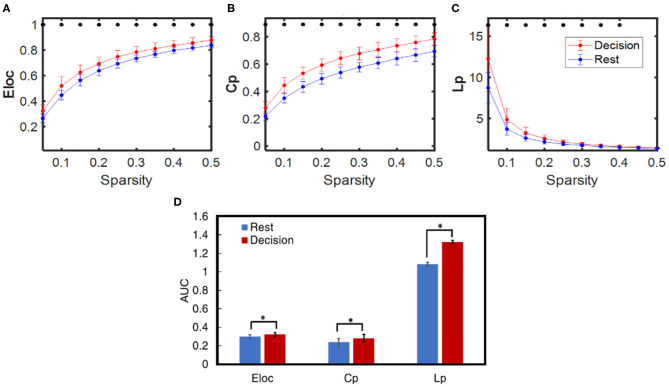
Figure 7.
Comparison of averaged dynamic functional network properties derived from GTA during NP decision (red) and rest (blue) phases for all subjects (n = 27): (A) Eloc, (B) Cp, and (C) Lp considering sparsity ranging from 0.05 to 0.5, and (D) three respective network metrics quantified by the area under the curve (AUC) within the sparsity of 0.05–0.5 for the decision (red) and rest (blue) phases. In all panels, the error bars are the standard deviation. The * indicates the significant difference between the decision and rest phase for each network metric at p < 0.01.

